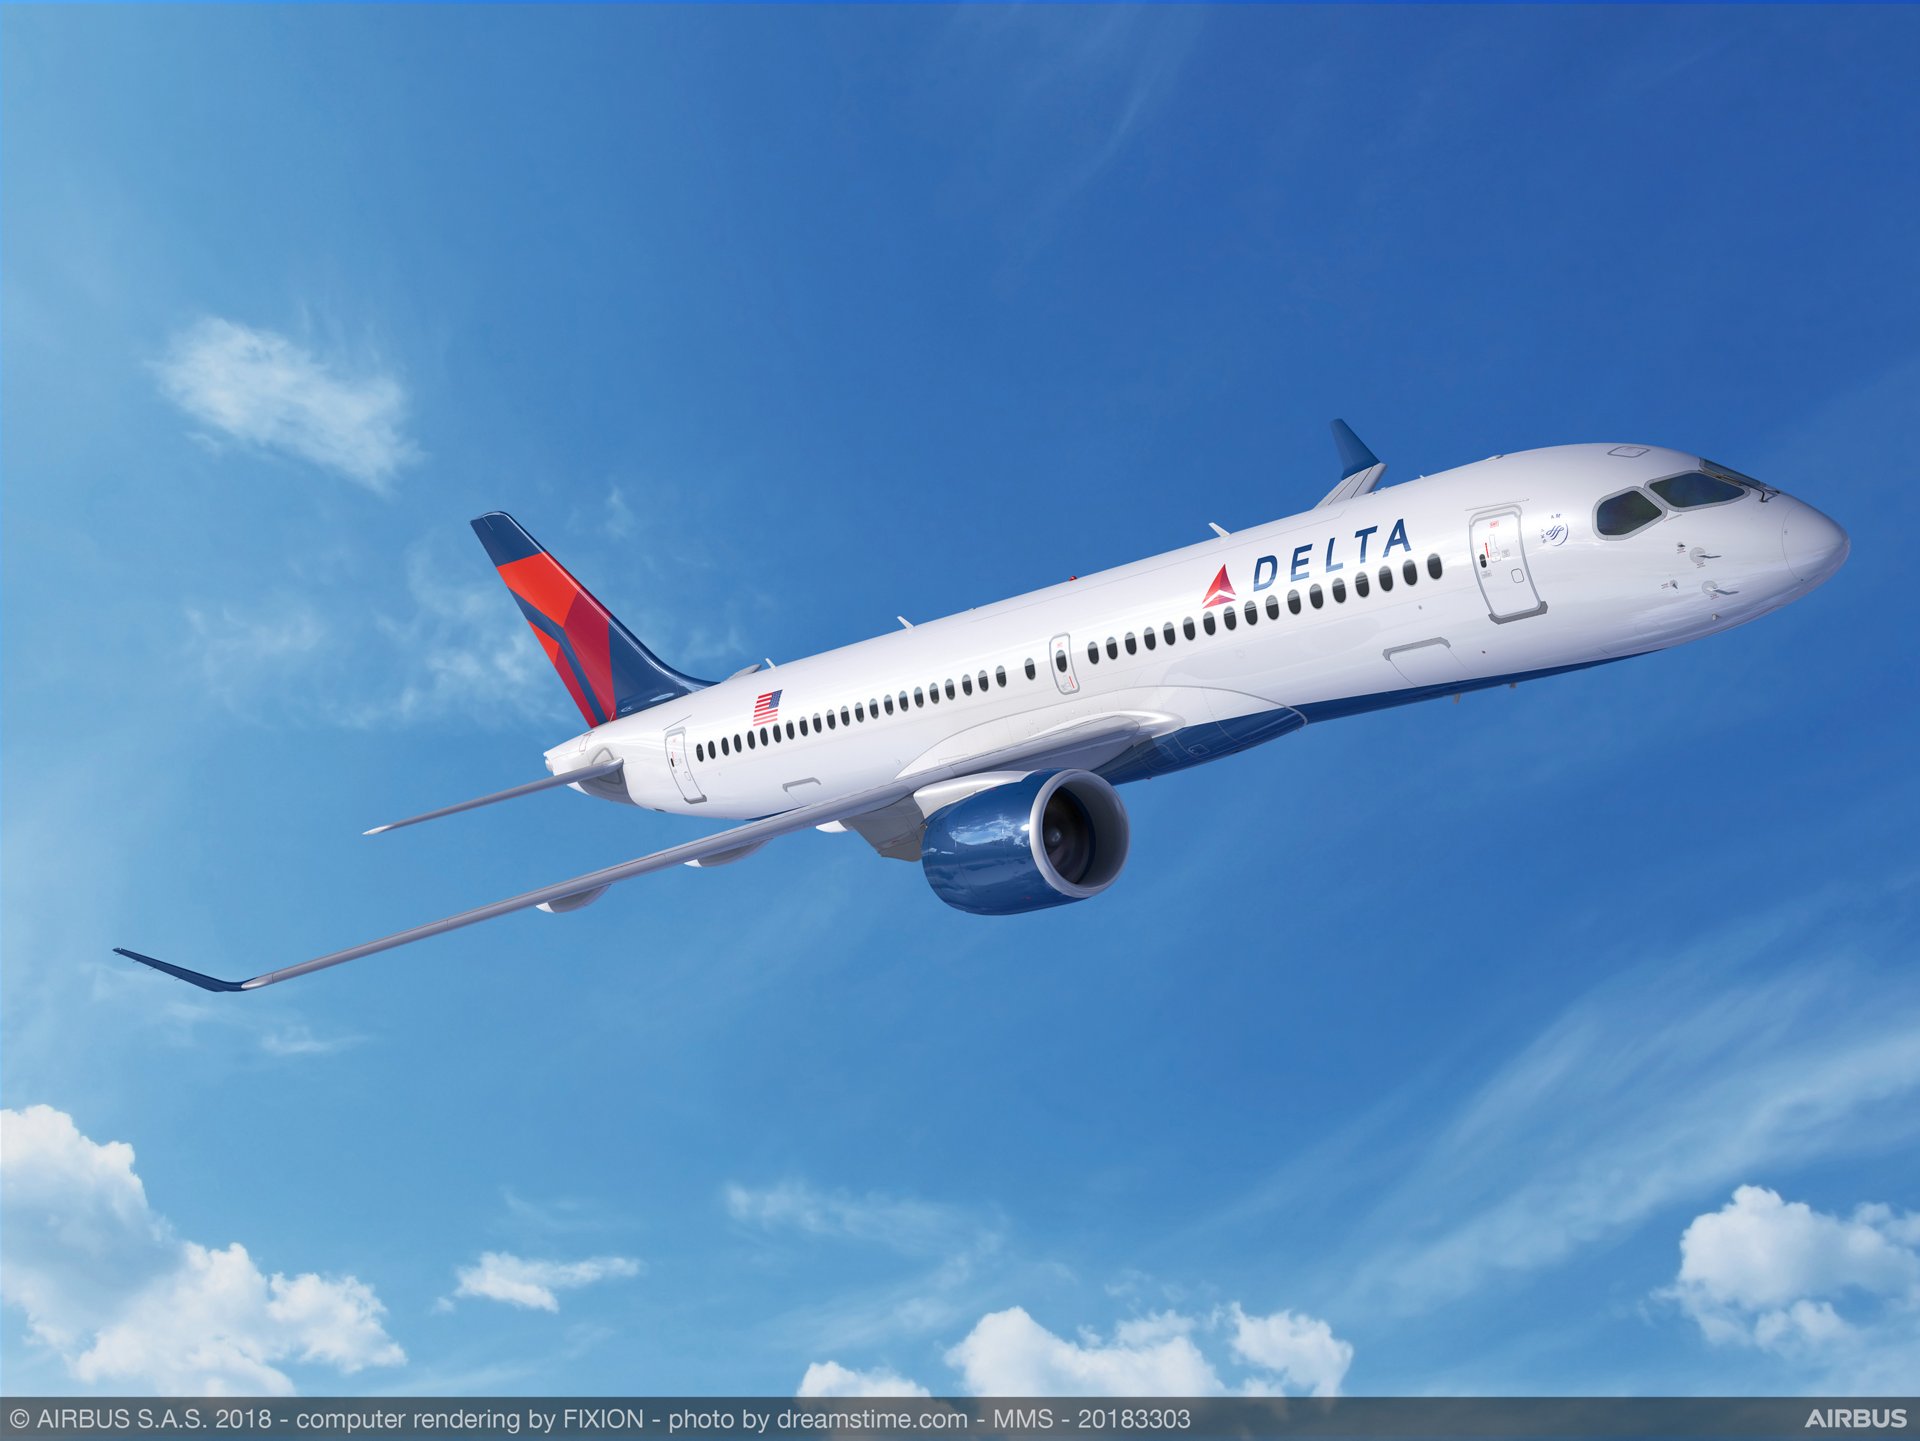
ATLANTA, July 14, 2021 – Delta Air Lines (NYSE: DAL) today reported financial results for the June quarter 2021 and provided its outlook for the September quarter 2021. Highlights of the June quarter 2021 results, including both GAAP and adjusted metrics, are on page six and are incorporated here.
June Quarter Financial Results
Adjusted pre-tax loss of $881 million excludes $1.5 billion of benefit related to the first and second payroll support program extensions (PSP2 and PSP3, respectively) and mark-to-market adjustments on our investments
Adjusted operating revenue of $6.3 billion, which excludes refinery sales, declined 49 percent on 39 percent lower sellable capacity (see Note A) versus June quarter 2019
Total operating expense, which includes $1.5 billion of benefit related to PSP2 and PSP3, decreased $4.1 billion relative to the June quarter 2019. Adjusted for the benefit related to the PSP programs and third-party refinery sales, total operating expense decreased $3.3 billion or 32 percent in the June quarter 2021 versus the comparable 2019 period
Generated $1.9 billion of operating cash flow, $1.5 billion of free cash flow and $195 million of free cash flow, adjusted in the June quarter
At the end of the June quarter, the company had $17.8 billion in liquidity, including cash and cash equivalents, short-term investments and undrawn revolving credit facilities. The company had total debt and finance lease obligations of $29.1 billion with adjusted net debt of $18.3 billion
Click the link below to read the full release, including the reconciliations of GAAP to non-GAAP financial measures:
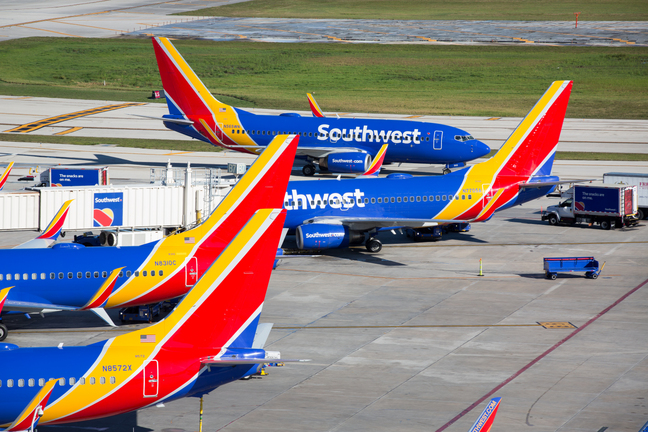
Southwest Airlines Company (NYSE: LUV) today announced an intention to bring the flexibility and value of Southwest Airlines® to three more new airports in 2021. Southwest Airlines Chairman and CEO Gary Kelly today is sharing the following message with the Employees of Southwest:
I’m pleased to share with you all that today we’re announcing our intention to serve three more destinations and continue our focus on putting our aircraft to work to pursue more Customers and much-needed revenue.
And the destinations are (drum roll!) Myrtle Beach, South Carolina; Eugene, Oregon; and Bellingham, Washington—three very different and appealing locations to both serve our existing Customers and places where we feel Southwest can make a real difference for local travelers.
We’re looking to start Myrtle Beach service in time for summer vacations and we expect our arrival to appeal to travelers who currently drive to this very popular coastal area in the Southeast. ‘Golf bags fly free’* should be very popular for Myrtle Beach service!
Eugene is about two hours south of Portland, and it’s ripe for the Southwest Effect, our Hospitality, and our flexible policies, with no hidden fees, and low fares.
Southwest service in Bellingham positions us just south of metro Vancouver, British Columbia. Following the reopening of the Canadian border, we expect a return of the value-minded travelers who already drive to this alternative airport to escape high fares and taxes—and that’s very, very typical for Southwest destinations. Southwest provides a great value for them.
Service to both Eugene and Bellingham is something we’ve anticipated in the second half of the year.
That makes 17 new airports that either we have opened or announced since the pandemic began. And for those that have commenced service, they’re performing very well. In fact, we just shared with the airports serving Steamboat Springs and Telluride that we’re extending our service beyond the winter season to continue serving both through the summer of 2021.
Colorado Springs, Savannah, and our Long Beach service to Hawaii all start-up this coming Thursday.
That’s a lot of work, a lot of new destinations, and a lot of options for our Customers and so I want to thank all of the Teams that have a hand in continuing to grow the Heart of Southwest while better positioning us to capture more Customers as the travel demand rebounds.
*Golf bags fly free as one of two checked pieces of baggage offered to every Southwest Customer (weight and size limitations apply)
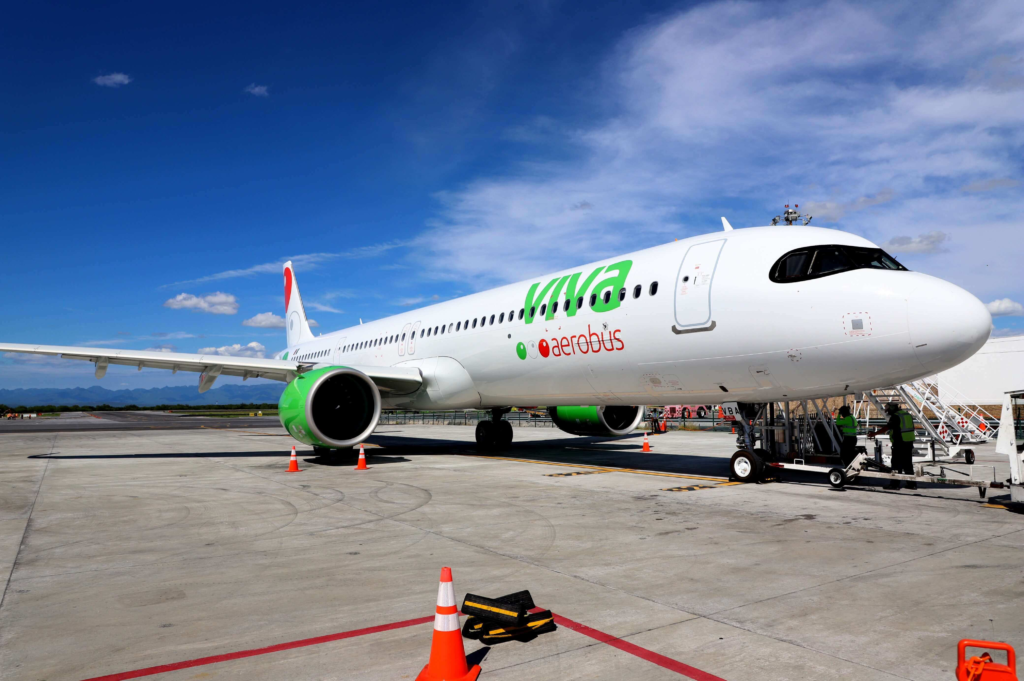
Mexico City, February 22, 2020. – Grupo Viva Aerobus today reported operating and financial results for 4Q20 and full year 2020, reflecting a recovery trend, amid the challenges of the pandemic, which began in the third quarter. This performance is the result of an adequate financial management, a strict expense control protecting the company’s liquidity and a responsible operational recovery which prioritizes health and safety for all passengers and staff.
During the 4Q, Viva Aerobus led the industry’s recovery, being the first airline in the Americas to resume 100% of its operational capacity, in November. Furthermore, Viva also consolidated as the first Mexican airline to grow its service at the end of the year by increasing its offer (available seats per kilometer) an 11% during December 2020 vs December 2019. In addition, the airline closed the year with 131 routes (103 domestic and 28 international), 12 more routes than the ones recorded at the end of 2019.
As a result of this recovery, added to an enhanced flexibility by permanently getting rid of charges for flight changes, Viva registered higher demand, closing 4Q20 with more than 2.9 million passengers, a 59% increase compared to 3Q2020. Moreover, the airline closed December with over one million of passengers registered, a similar figure reported in December 2019, before the pandemic.
This operational and passengers increase boosted the operating revenue to reach 3,237 million pesos in 4Q20, representing a 76.8% growth compared to 3Q20. Total operating revenue was composed 49% by fare revenue (1,589 million pesos) and 51% of ancillary revenue (1,647 million pesos). This revenue scheme represents the possibility that Viva Aerobus gives passengers to personalize their flights. Therefore, Viva takes care of their economy by offering low prices and giving the opportunity to pay only for what they need.
Due to this sequential increase in revenues, a positive EBITDAR was obtained for the second consecutive quarter, totaling 531 million pesos; this represented a sequential increase of 95% compared to 3Q20. Additionally, liquidity preservation stands out as attested in the cash and cash equivalents balance, recording 2,967 million pesos, a similar figure to the one reported in 3Q20. This reflects an assertive use of cash, taking advantage of an agile operational resumption, the support of the airline’s suppliers and the decisions to eliminate non-essential expenses.
These quarterly results softened the effects of the pandemic in the full year, considering that it was in the first half of 2020 when demand was most affected by the health emergency. Viva Aerobus registered more than 8.1 million annual passengers, a decrease of 32.4% compared to 2019. Consequently, total operating revenues reached 8,221 million pesos and EBITDAR totaled 946 million pesos, a 36.1% and 75.6% decrease, respectively.
To consult the full earnings report, please visit Viva Aerobus investor relations site: https://ri.vivaaerobus.com/en
Financial Indicators (MXN Million)
4Q20
4Q19
Ch. %
2020
2019
Ch. %
Total Revenue
3,237
3,728
(13.2%)
8,221
12,874
(36.1%)
EBITDAR*
531
1,122
(52.7%)
946
3,875
(75.6%)
EBITDAR Margin*
16.4%
30.1%
(13.7 p.p.)
11.5%
30.1%
(18.6 p.p.)
Operation (loss) income [EBIT]*
(427)
315
(>100.0%)
(2,619)
935
(>100.0%)
EBIT Margin*
(13.2%)
8.4%
(21.6 p.p.)
(31.9%)
7.3%
(39.1 p.p.)
Earnings Before Taxes (EBT)*
(791)
658
(>100.0%)
(3,881)
579
(>100.0%)
EBT Margin*
(24.4%)
17.7%
(42.1 p.p.)
(47.2%)
4.5%
(51.7 p.p.)
Net (loss) income*
(558)
420
(>100.0%)
(2,727)
469
(>100.0%)
Net Margin*
(17.2%)
11.3%
(28.5 p.p.)
(33.2%)
3.6%
(36.8 p.p.)
*Items not comparable with 2019 due to change in the functional currency conducted in 2020.
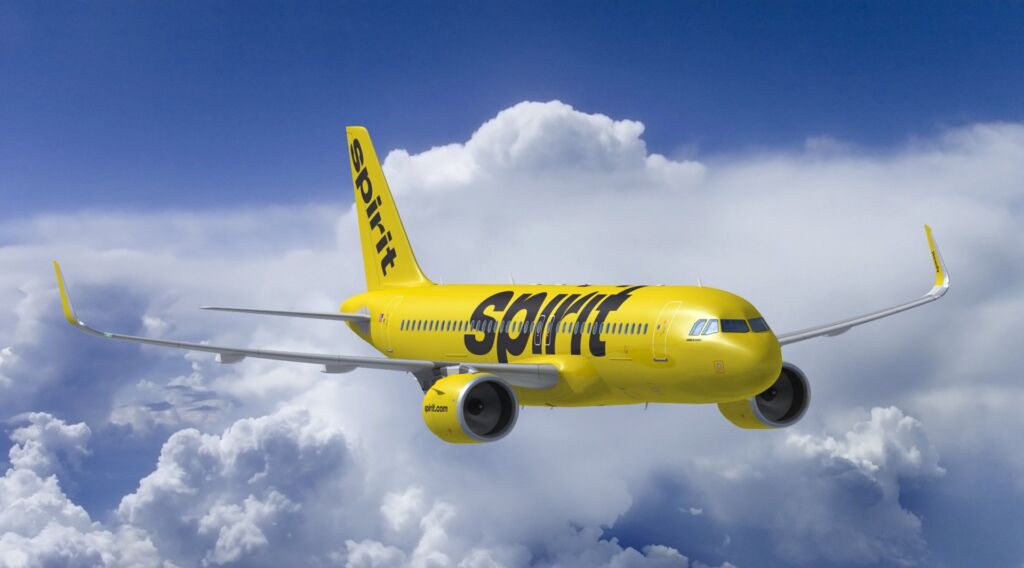
Spirit (NYSE: SAVE) came out with a quarterly loss of $1.61 per share versus the Zacks Consensus Estimate of a loss of $1.44. This compares to earnings of $1.24 per share a year ago. These figures are adjusted for non-recurring items.
This quarterly report represents an earnings surprise of -11.81%. A quarter ago, it was expected that this airline would post a loss of $2.63 per share when it actually produced a loss of $2.32, delivering a surprise of 11.79%.
Over the last four quarters, the company has surpassed consensus EPS estimates just once.
Financial results significantly impacted by COVID-19, 737 MAX grounding, and commercial widebody programs
777X program recorded $6.5 billion pre-tax charge; first delivery expected in late 2023
737 MAX began receiving regulatory approval to resume operations and restarted deliveries
Revenue of $15.3 billion, GAAP loss per share of ($14.65) and core (non-GAAP)* loss per share of ($15.25)
Full-Year 2020
Revenue of $58.2 billion, GAAP loss per share of ($20.88) and core (non-GAAP)* loss per share of ($23.25)
Operating cash flow of ($18.4) billion; cash and marketable securities of $25.6 billion
Total backlog of $363 billion, including more than 4,000 commercial airplanes
Strengthening safety processes, improving performance, managing liquidity and transforming for the future
Table 1. Summary Financial Results
Fourth Quarter
Full Year
(Dollars in Millions, except per share data)
2020
2019
Change
2020
2019
Change
Revenues
$15,304
$17,911
(15)%
$58,158
$76,559
(24)%
GAAP
Loss From Operations
($8,049)
($2,204)
NM
($12,767)
($1,975)
NM
Operating Margin
(52.6)%
(12.3)%
NM
(22.0)%
(2.6)%
NM
Net Loss
($8,439)
($1,010)
NM
($11,941)
($636)
NM
Loss Per Share
($14.65)
($1.79)
NM
($20.88)
($1.12)
NM
Operating Cash Flow
($4,009)
($2,220)
NM
($18,410)
($2,446)
NM
Non-GAAP*
Core Operating Loss
($8,377)
($2,526)
NM
($14,150)
($3,390)
NM
Core Operating Margin
(54.7)%
(14.1)%
NM
(24.3)%
(4.4)%
NM
Core Loss Per Share
($15.25)
($2.33)
NM
($23.25)
($3.47)
NM
*Non-GAAP measure; complete definitions of Boeing’s non-GAAP measures are on page 6, “Non-GAAP Measures Disclosures.”
The Boeing Company [NYSE: BA] reported fourth-quarter revenue of $15.3 billion, reflecting lower commercial deliveries and services volume primarily due to COVID-19 as well as 787 production issues, partially offset by a lower 737 MAX customer considerations charge in the quarter compared to the same period last year (Table 1). GAAP loss per share of ($14.65) and core loss per share (non-GAAP)* of ($15.25) reflected a $6.5 billion pre-tax charge on the 777X program and a tax valuation allowance, partially offset by a lower 737 MAX customer considerations charge. Boeing recorded operating cash flow of ($4.0) billion.
“2020 was a year of profound societal and global disruption which significantly constrained our industry. The deep impact of the pandemic on commercial air travel, coupled with the 737 MAX grounding, challenged our results. I am proud of the resilience and dedication our global team demonstrated in this environment as we strengthened our safety processes, adapted to our market and supported our customers, suppliers, communities and each other,” said Boeing President and Chief Executive Officer Dave Calhoun. “Our balanced portfolio of diverse defense, space and services programs continues to provide important stability as we lay the foundation for our recovery. While the impact of COVID-19 presents continued challenges for commercial aerospace into 2021, we remain confident in our future, squarely-focused on safety, quality and transparency as we rebuild trust and transform our business.”
The return to service of the 737 MAX in the U.S. and several other markets was an important step, and Boeing continues to follow the lead of global regulators and support its customers. Since the FAA’s approval to return to operations, Boeing has delivered over 40 737 MAX aircraft and five airlines have safely returned their fleets to service as of January 25, 2021, safely flying more than 2,700 revenue flights and approximately 5,500 flight hours.
Boeing now anticipates that the first 777X delivery will occur in late 2023. This schedule, and the associated financial impact, reflect a number of factors, including an updated assessment of global certification requirements, the company’s latest assessment of COVID-19 impacts on market demand, and discussions with its customers with respect to aircraft delivery timing.
Click the link below to read the full press release!
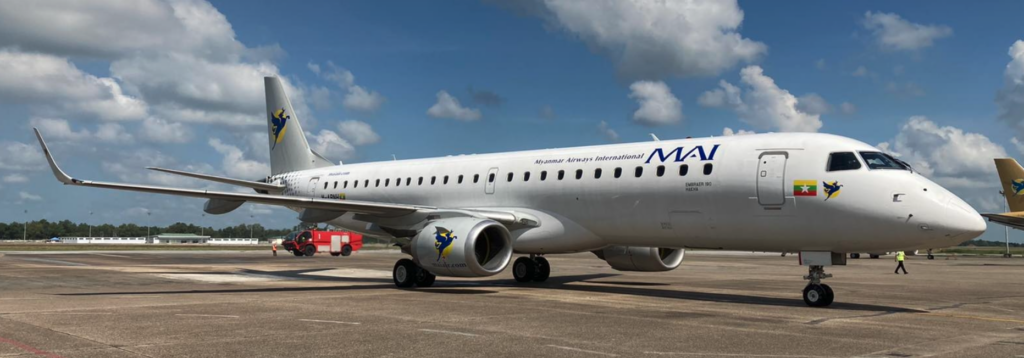
Myanmar Airways International’s (MAI) first E190 commenced operations from Yangon yesterday, operating four flights throughout the day. In addition, MAI’s second E190 is due to arrive in the country on 23 December 2020 and the airline will expand its E190 routes to include nine destinations across the country, upgauging from the turboprops used by its sister airline Air KBZ.
MAI has also signed on for Embraer’s Pool Program – a program enrolled by all E-Jet operators in Asia Pacific. There are now four new E-Jet operators in Asia Pacific (ex. China) since the start of 2020.
“Our pilots, cabin crew, maintenance crew and our staff are proud to take MAI’s E190 to the skies and to serve our passengers with an enhanced flying experience,” said Saravanan Ramasamy, Chief Executive Officer of MAI. “We look forward to a productive partnership with Embraer. The operation of the E190 marks yet another important milestone in MAI’s fleet expansion strategy and domestic jet network growth. As the demand grows, we plan to scale up the frequency of our E190 operations to eight flights a day.”
“The commencement of Myanmar Airways International’s E190 flights will enhance connectivity in Myanmar,” said Raul Villaron, Asia Pacific Vice President for Embraer Commercial Aviation. “The airline will benefit from the performance and efficiency of the aircraft and generous cargo capacity. Passengers will appreciate the comfort in the cabin. Myanmar Airways International can operate with full confidence that our excellent service and support team are here to support them.”
In preparation for the E190 operations, eight MAI pilots underwent the month-long Initial Pilot Training in September 2020 in Zhuhai, China. Separately, Embraer conducted the license-engineer type course for MAI’s engineers. Embraer’s Pool Program, which MAI has enrolled in offers full repair coverage for components and parts, airframe maintenance, and unlimited access to a large stock of components at the company’s distribution centers. Operators benefit from significant savings on repair and inventory costs, reduction in required warehousing space and resources required for repair management, while ultimately providing guaranteed performance levels. Singapore is the base for Embraer’s warehouse in the Asia Pacific region.
Embraer is the world’s leading manufacturer of commercial aircraft up to 150 seats with more than 100 customers from all over the world. For the E-Jets program alone, Embraer has logged more than 1,800 orders and 1,600 aircraft have been delivered. Today, E-Jets are flying in the fleet of more than 80 customers in some 50 countries. The versatile 70 to 150-seat family is flying with low-cost airlines as well as with regional and mainline carriers.
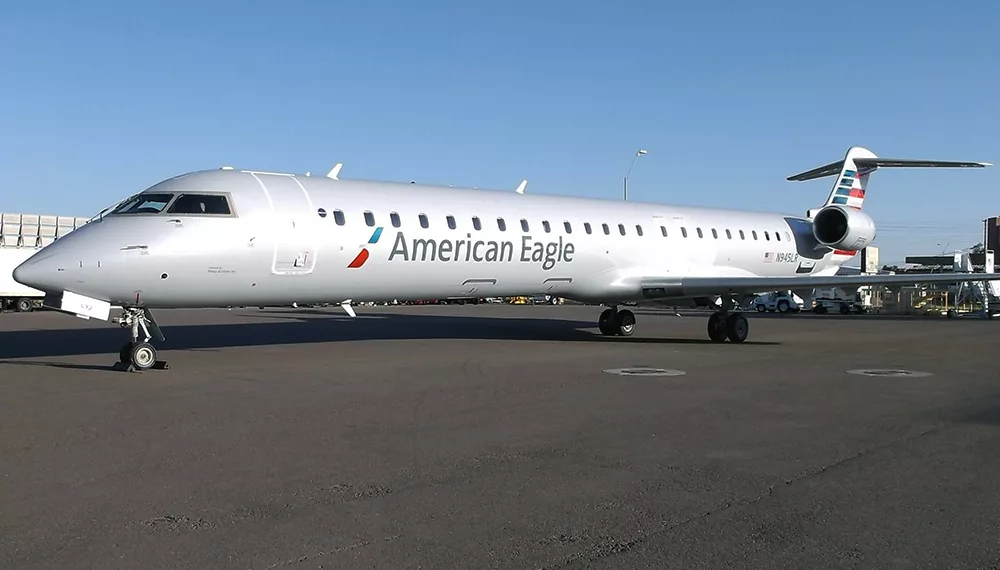
Mesa Air Group, Inc. (NASDAQ: MESA) today reported fourth quarter and full-year fiscal 2020 financial and operating results.
Mesa’s Q4 2020 results reflect net income of $11.4 million, or $0.32 per diluted share, compared to net income of $12.2 million, or $0.35 per diluted share for Q4 2019. Mesa Q4 2020 results include, per GAAP, the deferral of $7.8 million of revenue, all of which was billed and paid by American and United during the quarter and will be recognized over the remaining terms of the contracts. Mesa’s Adjusted EBITDA1 for Q4 2020 was $44.6 million, compared to $50.8 million in Q4 2019, and Adjusted EBITDAR1 was $54.2 million for Q4 2020, compared to $61.9 million in Q4 2019. For Q4 2020 revenue was $108.0 million, a reduction of $79.8 million (42%) from $187.8 for Q4 2019 primarily due to the reduced flying as a result of COVID-19. During the quarter Mesa recognized $40.8 million as an offset to wages and salaries related to the previously announced Payroll Support Program Agreement (“PSP”), which required Mesa to retain all of its employees.
Operationally, the Company ran a 99.8% controllable completion factor, compared to 99.0% in Q4 2019, and a total completion factor of 98.2%, which primarily includes weather, close-in capacity reductions driven by reduced demand, and other uncontrollable cancellations, compared to 96.9% in Q4 2019.
Full Year
Mesa reported net income of $27.5 million, or $0.78 per diluted share for the 2020 fiscal year, compared to net income of $47.6 million, or $1.36 per diluted share for the 2019 fiscal year. Excluding special items for both periods, adjusted net income1 was $27.5 million or $0.78 per diluted share for the 2020 fiscal year, compared to $57.5 million or $1.64 per diluted share for the 2019 fiscal year. Mesa fiscal 2020 results include, per GAAP, the deferral of $23.8 million of revenue, all of which was billed and paid by American and United during the year and will be recognized over the remaining terms of the contracts. Mesa’s Adjusted EBITDA1 was $163.3 million in fiscal year 2020, compared to $208.7 million in fiscal year 2019 and Adjusted EBITDAR was $212.1 million in fiscal year 2020, compared to $260.9 million in fiscal year 2019. For fiscal year 2020, revenue was $545.1 million, a reduction of $178.3 million (25%) from $723.4 million for fiscal year 2019, primarily due to the reduced flying as a result of COVID-19. During the year, Mesa recognized $83.8 million as an offset to wages and salaries related to the previously announced Payroll Support Program Agreement (“PSP”), which required Mesa to retain all of its employees as of April 20, 2020.
_______________ 1 See Reconciliation of non-GAAP financial measures
Fiscal 2020 Q4 Highlights
– EPS of $0.32, Full Year $0.78
– Year-end cash increased by $34.5 million to $99.4 million
Recent Updates
– Amended capacity purchase agreement with American to operate 40 CRJ-900s for a five-year term
– Commenced cargo operations for DHL with two Boeing 737-400F
– Added 10 new E175 aircraft to our United fleet in November and December
– Entered into a $195 million loan under the CARES Act with the U.S. Treasury
Boeing [NYSE: BA] today released its biennial World Air Cargo Forecast (WACF), reflecting COVID-19 impacts and opportunities as well as substantial long-term demand for freighters over the next two decades.
Enabled by a rebound in global trade and long-term growth, the WACF forecasts demand for 2,430 freighters over the next 20 years, including 930 new production freighters and 1,500 freighters converted from passenger airplanes.
According to the new forecast, world air cargo traffic will grow at 4% per year over the next 20 years. This growth is influenced by trade and growing express shipments to support expanding e-commerce operations. With these developments and the proven need for dedicated freighter capacity to support the world’s transportation system, the global air cargo fleet is expected to grow by more than 60% through 2039.
“Freighter operators have been in a unique position in 2020 to meet market requirements for speed, reliability and security, transporting medical supplies and other goods for people and communities around the world,” said Darren Hulst, vice president of Commercial Marketing. “Looking ahead, dedicated freighters will be even more critical to compete in air cargo markets; they carry more than half of air cargo traffic, and airlines operating them earn nearly 90% of air cargo industry revenue.”
In addition to projecting long-term demand for freighters, the WACF provides insights into air cargo performance during the pandemic, including the following:
– E-commerce, which was growing at double-digit rates prior to the pandemic, has accelerated its impact on the air cargo market as more businesses shifted to online selling platforms. Year to date through September, express carriers increased traffic by 14%
– Passenger belly cargo, which in 2019 accounted for about half of the world air cargo capacity, was significantly reduced when airlines parked thousands of planes. Freighter operators responded by operating above normal utilization levels, and traffic for all-cargo carriers grew 6%
– So far in 2020, approximately 200 airlines used more than 2,000 passenger widebody aircraft for cargo-only operations to generate cash flow and support global supply chains. These passenger freighters have taken up some of the capacity shortfall and, in some cases, generated quarterly profits for carriers despite minimal passenger operations
– Financial results continue to be significantly impacted by COVID-19 and the 737 MAX grounding
– Proactively managing liquidity and transforming for the future
– Revenue of $14.1 billion, GAAP loss per share of ($0.79) and core (non-GAAP)* loss per share of ($1.39)
– Operating cash flow of ($4.8) billion; cash and marketable securities of $27.1 billion
– Total backlog of $393 billion, including more than 4,300 commercial airplanes
Table 1. Summary Financial Results
Third Quarter
Nine Months
(Dollars in Millions, except per share data)
2020
2019
Change
2020
2019
Change
Revenues
$14,139
$19,980
(29)%
$42,854
$58,648
(27)%
GAAP
(Loss)/Earnings From Operations
($401)
$1,259
NM
($4,718)
$229
NM
Operating Margin
(2.8)%
6.3%
NM
(11.0)%
0.4%
NM
Net (Loss)/Earnings
($466)
$1,167
NM
($3,502)
$374
NM
(Loss)/Earnings Per Share
($0.79)
$2.05
NM
($6.10)
$0.66
NM
Operating Cash Flow
($4,819)
($2,424)
NM
($14,401)
($226)
NM
Non-GAAP*
Core Operating (Loss)/Earnings
($754)
$895
NM
($5,773)
($864)
NM
Core Operating Margin
(5.3)%
4.5%
NM
(13.5)%
(1.5)%
NM
Core (Loss)/Earnings Per Share
($1.39)
$1.45
NM
($7.88)
($1.13)
NM
*Non-GAAP measure; complete definitions of Boeing’s non-GAAP measures are on page 5, “Non-GAAP Measures Disclosures.”
The Boeing Company [NYSE: BA] reported third-quarter revenue of $14.1 billion, GAAP loss per share of ($0.79) and core loss per share (non-GAAP)* of ($1.39), reflecting lower commercial deliveries and services volume primarily due to COVID-19 (Table 1). Boeing recorded operating cash flow of ($4.8) billion.
“The global pandemic continued to add pressure to our business this quarter, and we’re aligning to this new reality by closely managing our liquidity and transforming our enterprise to be sharper, more resilient and more sustainable for the long term,” said Boeing President and Chief Executive Officer Dave Calhoun. “Our diverse portfolio, including our government services, defense and space programs, continues to provide some stability for us as we adapt and rebuild for the other side of the pandemic. We remain focused on the health and safety of our employees and their communities. I’m proud of the dedication and commitment our teams have demonstrated as they continued to deliver for our customers in this challenging environment. Despite the near-term headwinds, we remain confident in our long term future and are focused on sustaining critical investments in our business and the meaningful actions we are taking to strengthen our safety culture, improve transparency and rebuild trust.”
Following the lead of global regulators, Boeing made steady progress toward the safe return to service of the 737 MAX, including rigorous certification and validation flights conducted by the U.S. Federal Aviation Administration, Transport Canada and the European Union Aviation Safety Agency. The Joint Operational Evaluation Board, featuring civil aviation authorities from the United States, Canada, Brazil, and the European Union, also conducted its evaluations of updated crew training. The 737 MAX has now completed around 1,400 test and check flights and more than 3,000 flight hours as it progresses through the robust and comprehensive certification process.
To adapt to the market impacts of COVID-19 and position the company for the future, Boeing continued its business transformation across five key areas including its infrastructure footprint, overhead and organizational structure, portfolio and investment mix, supply chain health and operational excellence. As the company resizes its operations to align with market realities, Boeing expects to continue lowering overall staffing levels through natural attrition as well as voluntary and involuntary workforce reductions, and recorded additional severance costs in the third quarter.
Table 2. Cash Flow
Third Quarter
Nine Months
(Millions)
2020
2019
2020
2019
Operating Cash Flow
($4,819)
($2,424)
($14,401)
($226)
Less Additions to Property, Plant & Equipment
($262)
($465)
($1,038)
($1,387)
Free Cash Flow*
($5,081)
($2,889)
($15,439)
($1,613)
*Non-GAAP measure; complete definitions of Boeing’s non-GAAP measures are on page 5, “Non-GAAP Measures Disclosures.”
Operating cash flow was ($4.8) billion in the quarter, reflecting lower commercial deliveries and services volume primarily due to COVID-19, as well as timing of receipts and expenditures (Table 2).
Table 3. Cash, Marketable Securities and Debt Balances
Quarter-End
(Billions)
Q3 20
Q2 20
Cash
$10.6
$20.0
Marketable Securities1
$16.5
$12.4
Total
$27.1
$32.4
Debt Balances:
The Boeing Company, net of intercompany loans to BCC
$59.1
$59.5
Boeing Capital, including intercompany loans
$1.9
$1.9
Total Consolidated Debt
$61.0
$61.4
1Marketable securities consists primarily of time deposits due within one year classified as “short-term investments.”
Cash and investments in marketable securities decreased to $27.1 billion, compared to $32.4 billion at the beginning of the quarter, primarily driven by operating cash outflows (Table 3). Debt was $61.0 billion, down from $61.4 billion at the beginning of the quarter due to the repayment of maturing debt.
Total company backlog at quarter-end was $393 billion.
Segment Results
Commercial Airplanes
Table 4. Commercial Airplanes
Third Quarter
Nine Months
(Dollars in Millions)
2020
2019
Change
2020
2019
Change
Commercial Airplanes Deliveries
28
62
(55)%
98
301
(67)%
Revenues
$3,596
$8,249
(56)%
$11,434
$24,793
(54)%
Loss from Operations
($1,369)
($40)
NM
($6,199)
($3,813)
NM
Operating Margin
(38.1)%
(0.5)%
NM
(54.2)%
(15.4)%
NM
Commercial Airplanes third-quarter revenue decreased to $3.6 billion, reflecting lower delivery volume primarily due to COVID-19 impacts as well as 787 quality issues and associated rework. Third-quarter operating margin decreased to (38.1) percent, primarily driven by lower delivery volume, as well as $590 million of abnormal production costs related to the 737 program.
Commercial Airplanes added the final 777X flight test airplane to the test program and the GE9X engine received FAA certification. In October, the company decided it will consolidate 787 production in South Carolina in mid-2021, which did not have a significant financial impact on the program in the third quarter. Commercial Airplanes delivered 28 airplanes during the quarter, and backlog included over 4,300 airplanes valued at $313 billion.
Defense, Space & Security
Table 5. Defense, Space & Security
Third Quarter
Nine Months
(Dollars in Millions)
2020
2019
Change
2020
2019
Change
Revenues
$6,848
$7,002
(2)%
$19,478
$20,168
(3)%
Earnings from Operations
$628
$754
(17)%
$1,037
$2,581
(60)%
Operating Margin
9.2%
10.8%
(1.6) Pts
5.3%
12.8%
(7.5) Pts
Defense, Space & Security third-quarter revenue decreased to $6.8 billion, primarily due to derivative aircraft award timing, partially offset by higher fighter volume (Table 5). Third-quarter operating margin decreased to 9.2 percent reflecting less favorable performance, including a $67 million KC-46A Tanker charge.
During the quarter, Defense, Space & Security received an award for eight F-15EX advanced fighter aircraft for the U.S. Air Force and a contract extension for the International Space Station for NASA, as well as contracts for nine additional MH-47G Block II Chinook helicopters for the U.S. Army Special Operations and four additional 702X satellites. Also in the quarter, the U.S. Air Force and Boeing team was awarded the Collier Trophy for aerospace excellence for the X-37B autonomous spaceplane. Significant milestones included inducting the 20th U.S. Navy F/A-18 into the Service Life Modification program as well as delivering the firstBell Boeing V-22 Osprey to Japan and the first MH-47G Block II Chinook to the U.S. Army Special Operations.
Backlog at Defense, Space & Security was $62 billion, of which 30 percent represents orders from customers outside the U.S.
Global Services
Table 6. Global Services
Third Quarter
Nine Months
(Dollars in Millions)
2020
2019
Change
2020
2019
Change
Revenues
$3,694
$4,658
(21)%
$11,810
$13,820
(15)%
Earnings from Operations
$271
$673
(60)%
$307
$2,013
(85%)
Operating Margin
7.3%
14.4%
(7.1) Pts
2.6%
14.6%
(12.0) Pts
Global Services third-quarter revenue decreased to $3.7 billion, driven by lower commercial services volume due to COVID-19, partially offset by higher government services volume (Table 6). Third-quarter operating margin decreased to 7.3 percent primarily due to lower commercial services volume and additional severance costs.
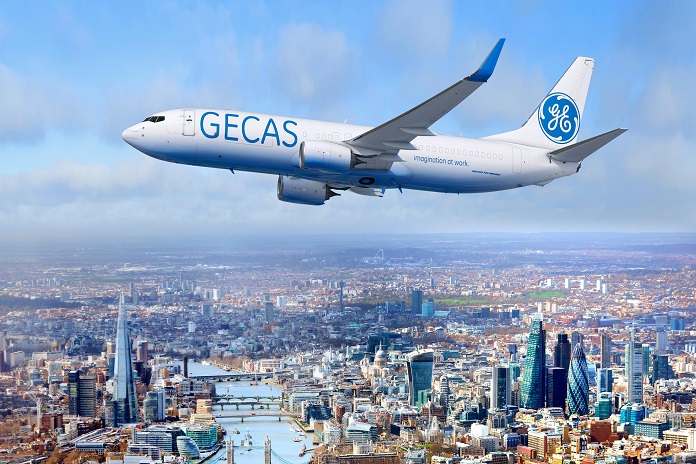
During the quarter, Global Services signed an agreement with GECAS for 11 737-800 Boeing Converted Freighters, secured a six-year P-8A support contract for the Royal Australian Air Force, and was awarded F-15EX training and services support contracts by the U.S. Air Force. Global Services also delivered the first P-8A Operational Flight Trainer for the United Kingdom Royal Air Force.
Additional Financial Information
Table 7. Additional Financial Information
Third Quarter
Nine Months
(Dollars in Millions)
2020
2019
2020
2019
Revenues
Boeing Capital
$71
$66
$205
$207
Unallocated items, eliminations and other
($70)
$5
($73)
($340)
Earnings from Operations
Boeing Capital
$30
$29
$47
$86
FAS/CAS service cost adjustment
$353
$364
$1,055
$1,093
Other unallocated items and eliminations
($314)
($521)
($965)
($1,731)
Other income, net
$119
$121
$325
$334
Interest and debt expense
($643)
($203)
($1,458)
($480)
Effective tax rate
49.6%
0.8%
40.1%
(350.6)%
At quarter-end, Boeing Capital’s net portfolio balance was $2.0 billion. The change in revenue and earnings from other unallocated items and eliminations was primarily due to the timing of cost allocations. Earnings from other unallocated items and eliminations was also impacted by lower enterprise research and development expense. Interest and debt expense increased due to higher debt balances. The third quarter effective tax rate reflects tax benefits related to the five year net operating loss carryback provision in the Coronavirus Aid, Relief, and Economic Security (CARES) Act as well as the impact of pre-tax losses.
Non-GAAP Measures Disclosures
We supplement the reporting of our financial information determined under Generally Accepted Accounting Principles in the United States of America (GAAP) with certain non-GAAP financial information. The non-GAAP financial information presented excludes certain significant items that may not be indicative of, or are unrelated to, results from our ongoing business operations. We believe that these non-GAAP measures provide investors with additional insight into the company’s ongoing business performance. These non-GAAP measures should not be considered in isolation or as a substitute for the related GAAP measures, and other companies may define such measures differently. We encourage investors to review our financial statements and publicly-filed reports in their entirety and not to rely on any single financial measure. The following definitions are provided:
Core Operating Earnings, Core Operating Margin and Core Earnings Per Share
Core operating earnings is defined as GAAP earnings from operations excluding the FAS/CAS service cost adjustment. The FAS/CAS service cost adjustment represents the difference between the FAS pension and postretirement service costs calculated under GAAP and costs allocated to the business segments. Core operating margin is defined as core operating earnings expressed as a percentage of revenue. Core earnings per share is defined as GAAP diluted earnings per share excluding the net earnings per share impact of the FAS/CAS service cost adjustment and Non-operating pension and postretirement expenses. Non-operating pension and postretirement expenses represent the components of net periodic benefit costs other than service cost. Pension costs, comprising service and prior service costs computed in accordance with GAAP are allocated to Commercial Airplanes and BGS businesses supporting commercial customers. Pension costs allocated to BDS and BGS businesses supporting government customers are computed in accordance with U.S. Government Cost Accounting Standards (CAS), which employ different actuarial assumptions and accounting conventions than GAAP. CAS costs are allocable to government contracts. Other postretirement benefit costs are allocated to all business segments based on CAS, which is generally based on benefits paid. Management uses core operating earnings, core operating margin and core earnings per share for purposes of evaluating and forecasting underlying business performance. Management believes these core earnings measures provide investors additional insights into operational performance as they exclude non-service pension and post-retirement costs, which primarily represent costs driven by market factors and costs not allocable to government contracts. A reconciliation between the GAAP and non-GAAP measures is provided on pages 12-13.
Free Cash Flow
Free cash flow is GAAP operating cash flow reduced by capital expenditures for property, plant and equipment. Management believes free cash flow provides investors with an important perspective on the cash available for shareholders, debt repayment, and acquisitions after making the capital investments required to support ongoing business operations and long term value creation. Free cash flow does not represent the residual cash flow available for discretionary expenditures as it excludes certain mandatory expenditures such as repayment of maturing debt. Management uses free cash flow as a measure to assess both business performance and overall liquidity. Table 2 provides a reconciliation of free cash flow to GAAP operating cash flow.
Caution Concerning Forward-Looking Statements
This press release contains “forward-looking statements” within the meaning of the Private Securities Litigation Reform Act of 1995. Words such as “may,” “should,” “expects,” “intends,” “projects,” “plans,” “believes,” “estimates,” “targets,” “anticipates,” and similar expressions generally identify these forward-looking statements. Examples of forward-looking statements include statements relating to our future financial condition and operating results, as well as any other statement that does not directly relate to any historical or current fact. Forward-looking statements are based on expectations and assumptions that we believe to be reasonable when made, but that may not prove to be accurate. These statements are not guarantees and are subject to risks, uncertainties, and changes in circumstances that are difficult to predict. Many factors could cause actual results to differ materially and adversely from these forward-looking statements. Among these factors are risks related to: (1) the COVID-19 pandemic and related government actions, including with respect to our operations, our liquidity, the health of our customers and suppliers, and future demand for our products and services; (2) the 737 MAX, including the timing and conditions of 737 MAX regulatory approvals, lower than planned production rates and/or delivery rates, and increased considerations to customers and suppliers, (3) general conditions in the economy and our industry, including those due to regulatory changes; (4) our reliance on our commercial airline customers; (5) the overall health of our aircraft production system, planned commercial aircraft production rate changes, our commercial development and derivative aircraft programs, and our aircraft being subject to stringent performance and reliability standards; (6) changing budget and appropriation levels and acquisition priorities of the U.S. government; (7) our dependence on U.S. government contracts; (8) our reliance on fixed-price contracts; (9) our reliance on cost-type contracts; (10) uncertainties concerning contracts that include in-orbit incentive payments; (11) our dependence on our subcontractors and suppliers, as well as the availability of raw materials; (12) changes in accounting estimates; (13) changes in the competitive landscape in our markets; (14) our non-U.S. operations, including sales to non-U.S. customers; (15) threats to the security of our or our customers’ information; (16) potential adverse developments in new or pending litigation and/or government investigations; (17) customer and aircraft concentration in our customer financing portfolio; (18) changes in our ability to obtain debt financing on commercially reasonable terms and at competitive rates; (19) realizing the anticipated benefits of mergers, acquisitions, joint ventures/strategic alliances or divestitures; (20) the adequacy of our insurance coverage to cover significant risk exposures; (21) potential business disruptions, including those related to physical security threats, information technology or cyber-attacks, epidemics, sanctions or natural disasters; (22) work stoppages or other labor disruptions; (23) substantial pension and other postretirement benefit obligations; and (24) potential environmental liabilities.
Additional information concerning these and other factors can be found in our filings with the Securities and Exchange Commission, including our most recent Annual Report on Form 10-K, Quarterly Reports on Form 10-Q and Current Reports on Form 8-K. Any forward-looking statement speaks only as of the date on which it is made, and we assume no obligation to update or revise any forward-looking statement, whether as a result of new information, future events, or otherwise, except as required by law.