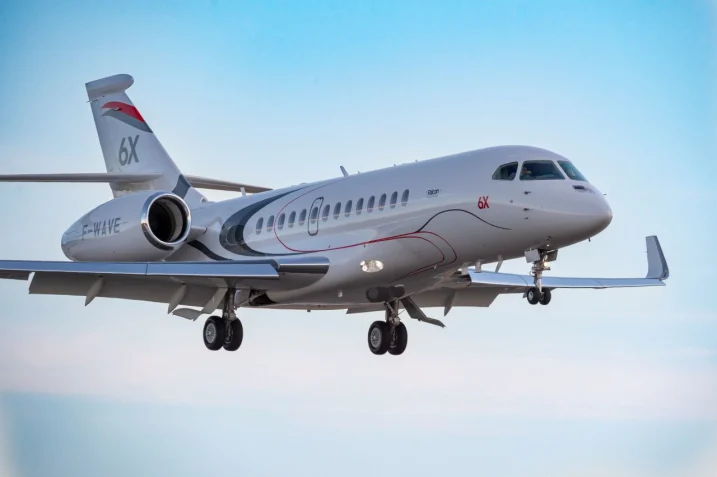
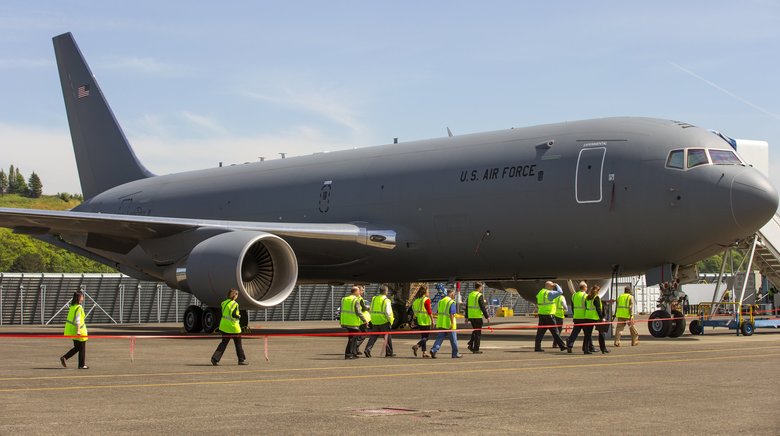
A third Falcon 6X recently took flight and joined Dassault Aviation’s flight test campaign, moving the new long-range extra widebody twin a step closer to anticipated certification in 2022.
Falcon 6X s/n 003 is fitted with a full interior and will be used for cabin design validation. The aircraft completed a two-hour maiden flight from Dassault’s Bordeaux-Mérignac final assembly plant to its Istres flight test facility on June 24, climbing to Flight Level 400 and accelerating to a cruise speed of Mach 0.85. The first 6X flew on March 10 and the second on April 30.
Aircraft no. 3 is outfitted with the Falcon 6X’s award winning interior, including in-flight entertainment and communications systems. In addition to testing this equipment, the aircraft will be used to evaluate environmental features and temperature control and validate cabin acoustics systems, which alongside those on the ultra long-range Falcon 8X trijet are expected to be the industry reference.
A fourth aircraft will also be equipped with a full cabin interior, currently being installed in Mérignac. It will conduct a two-month global endurance flight campaign intended to ensure that all 6X systems are fully mature upon entry into service.
Production of additional units is in full swing, with aircraft no. 10 scheduled to be on the final assembly line by beginning of July. The Falcon 6X has received several prestigious design awards, including the Red Dot prize for premium cabin design. The aircraft was recognized this month as the “Best of the Best” in aviation by the Robb Report luxury-lifestyle magazine, which noted: “Dassault’s newest aircraft pairs size with technology to create an award-worthy new class of business jet.”
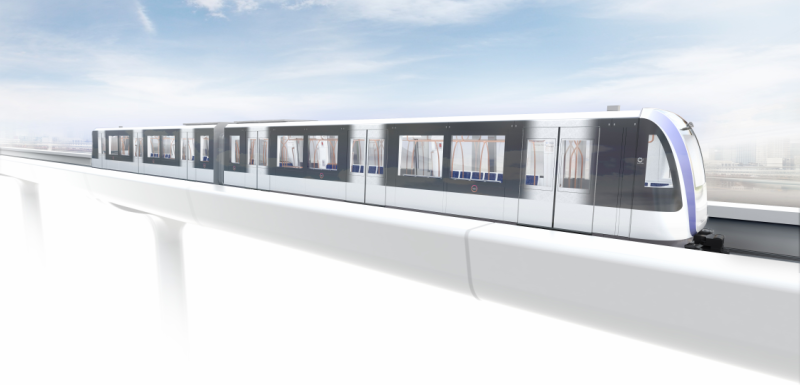
Alstom has been awarded the contract by Toulouse Metropole for the system for the third and new 27 km metro line, called Toulouse Aerospace Express, for the sum of more than €470 M. The contract could eventually be worth €713 M, including all options. The line consists of 21 stations and will serve the aviation labour pool.
The firm tranche of the order guarantees a transport capacity of 5,000 passengers per hour in each direction (pphpd), with options for up to 10,000 pphpd. It includes Alstom’s efficient, proven “Systems” solutions: Metropolis™ trains and Urbalis™ 400 CBTC solution for driverless operation and Hesop™ reversible substations. The scope also includes platform screen doors, including a dynamic system for load indication, and the track including the laying with the automated solution Appitrack™. Finally, the firm tranche of the order includes six years of maintenance, with 12 years of maintenance as an option.
“This order is excellent news for Alstom and I would like to thank Tisséo and Toulouse Metropole for their confidence! Alstom has submitted a very competitive system offer, while proposing its latest technologies and innovations on the various subsystems (vehicles, signalling, infrastructure and power supply). This order will enable us to continue developing our skills in France in all these areas, as well as our presence in the region of Occitanie, already in full expansion with our centres of excellence for Electrical component’in Toulouse and traction in Tarbes, and soon the Line 3 project team. We’ll also be calling on a number of local partners,” says Jean-Baptiste Eyméoud, President of Alstom in France.
The city of Toulouse is renowned for its economic vitality and the quality of life of the surrounding region. The Toulouse Aerospace Express project is part of a drive to increase the city’s appeal with the help of sustainable, inclusive mobility.
Alstom will contribute to the economic vitality of the local area with its site in Toulouse, which will be the nerve centre of the project. The site will consequently be developed for the construction and maintenance activities, thereby promoting local employment. In total, more than 600 people in France will work on this project, including up to 400 people in the Toulouse metropolitan area at the peak of the activity. 80% of the hours spent working on this project will be in France and 55% directly in the region of Occitanie. Jobs will also be created with our suppliers in France and in the city of Toulouse for the activities of installation, infrastructure and system deployment.
Alstom’s integrated Systems solution provides a highly mature, efficient and comfortable transport offer, designed with maximum operability and reliability in mind, with record availability of 99.8%. Alstom has a global leadership position and fully proven experience in the successful construction, commissioning and delivery of new integrated metro systems, as well as in their safe, reliable and efficient operation. Alstom can boast more than 65 years’ experience, having sold over 17,000 metro cars that carry 30 million passengers every day operate in 55 cities around the world. One of the most recent successes for Alstom in integrated metro projects being the 15-kilometre-long Dubai Metro Route 2020, completed and delivered in July 2020
The design selected for the system and the metro makes it possible to propose a solution that minimises waiting time in stations, with reduced traffic frequency from the moment of entry into service, but which, by increasing the number of metro cars from 2 to 3, increases the transport offer to 15,000 passengers per hour in each direction, without modifying the infrastructure. Indeed, Alstom will design the system to be able to go up to 15,000. The base contract is for 5,000 with options to go up to 10,000.
The rolling stock belongs to the Métropolis™ range of trains. It benefits from the innovations and continuous improvement brought to this product for more than 15 years, through numerous R&D programmes and contracts executed throughout the world. This state-of-the-art metro has been designed to improve passenger experience as well as reconcile performance, energy efficiency and ease of maintenance, in order to control costs throughout its life cycle.
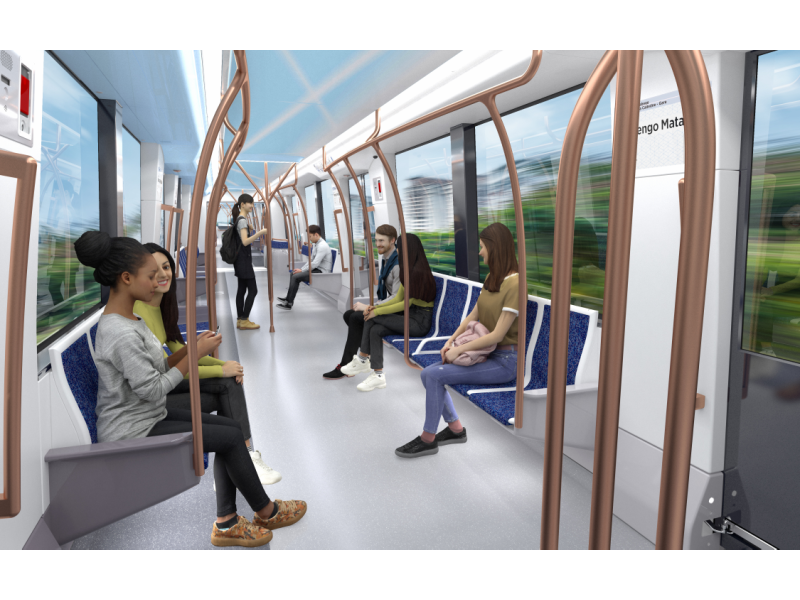
For passengers, as it is a new line, the train will be characterised in particular by increased volumes on board and large openings to the exterior. The experience of the journey will be made more pleasant with an atmosphere that is air-conditioned and quiet, LED lighting that adjusts to travel conditions, reinforced air filtration and antibacterial coatings on the handholds for a healthier interior.
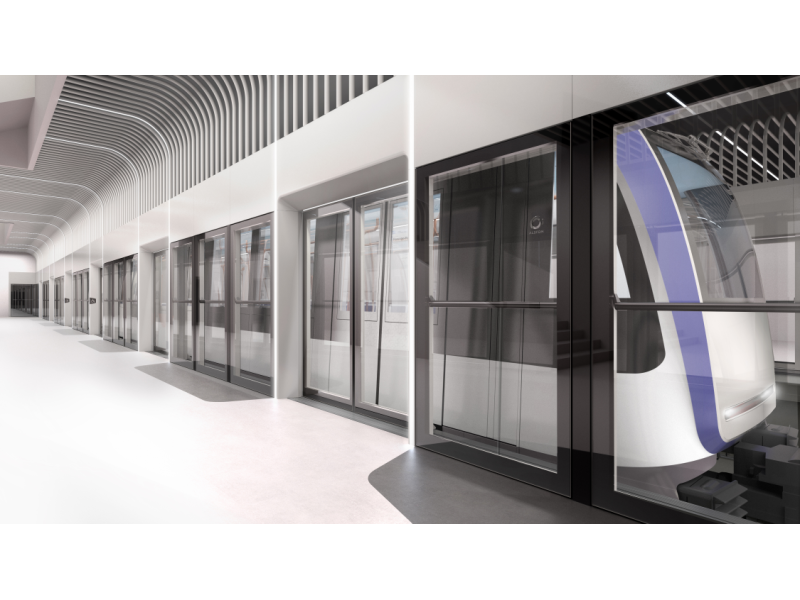
Travel will be made easier from the moment you step on board, with, for example, platform facades indicating the density of people on board the cars.
Urbalis™ 400 is a proven, efficient CBTC (Communication Based Train Control) automatic operation solution, in commercial service in many cities around the world. Deployed or in the process of being deployed on more than 100 metro lines, notably in Lyon and Marseille, Urbalis 400™ is a generic solution, managed as a platform, to ensure optimum safety and reliability as well as long-term durability. The solution has also demonstrated its operational robustness and modular capabilities, enabling it to control sensitive interfaces such as those of the train or the centralised control centre.
The transport system solution provided by Alstom has also been designed to reduce operational costs, achieving major energy savings through a combination of reversible Hesop™ substations with regenerative braking, efficient traction and braking systems and improved CBTC automatic train control strategies.
And finally, the project also includes the construction of a rail track that reduces friction and fine particles to a minimum, thanks to steel-on-steel operation and offers guaranteed performance over time.
With this contract, Alstom is making a long-term commitment to mobility in Toulouse by ensuring the construction and maintenance of this third line on behalf of Tisséo.
– Financial results continue to be significantly impacted by COVID-19 and the 737 MAX grounding
– Proactively managing liquidity and transforming for the future
– Revenue of $14.1 billion, GAAP loss per share of ($0.79) and core (non-GAAP)* loss per share of ($1.39)
– Operating cash flow of ($4.8) billion; cash and marketable securities of $27.1 billion
– Total backlog of $393 billion, including more than 4,300 commercial airplanes
Table 1. Summary Financial Results
Third Quarter
Nine Months
(Dollars in Millions, except per share data)
2020
2019
Change
2020
2019
Change
Revenues
$14,139
$19,980
(29)%
$42,854
$58,648
(27)%
GAAP
(Loss)/Earnings From Operations
($401)
$1,259
NM
($4,718)
$229
NM
Operating Margin
(2.8)%
6.3%
NM
(11.0)%
0.4%
NM
Net (Loss)/Earnings
($466)
$1,167
NM
($3,502)
$374
NM
(Loss)/Earnings Per Share
($0.79)
$2.05
NM
($6.10)
$0.66
NM
Operating Cash Flow
($4,819)
($2,424)
NM
($14,401)
($226)
NM
Non-GAAP*
Core Operating (Loss)/Earnings
($754)
$895
NM
($5,773)
($864)
NM
Core Operating Margin
(5.3)%
4.5%
NM
(13.5)%
(1.5)%
NM
Core (Loss)/Earnings Per Share
($1.39)
$1.45
NM
($7.88)
($1.13)
NM
*Non-GAAP measure; complete definitions of Boeing’s non-GAAP measures are on page 5, “Non-GAAP Measures Disclosures.”
The Boeing Company [NYSE: BA] reported third-quarter revenue of $14.1 billion, GAAP loss per share of ($0.79) and core loss per share (non-GAAP)* of ($1.39), reflecting lower commercial deliveries and services volume primarily due to COVID-19 (Table 1). Boeing recorded operating cash flow of ($4.8) billion.
“The global pandemic continued to add pressure to our business this quarter, and we’re aligning to this new reality by closely managing our liquidity and transforming our enterprise to be sharper, more resilient and more sustainable for the long term,” said Boeing President and Chief Executive Officer Dave Calhoun. “Our diverse portfolio, including our government services, defense and space programs, continues to provide some stability for us as we adapt and rebuild for the other side of the pandemic. We remain focused on the health and safety of our employees and their communities. I’m proud of the dedication and commitment our teams have demonstrated as they continued to deliver for our customers in this challenging environment. Despite the near-term headwinds, we remain confident in our long term future and are focused on sustaining critical investments in our business and the meaningful actions we are taking to strengthen our safety culture, improve transparency and rebuild trust.”
Following the lead of global regulators, Boeing made steady progress toward the safe return to service of the 737 MAX, including rigorous certification and validation flights conducted by the U.S. Federal Aviation Administration, Transport Canada and the European Union Aviation Safety Agency. The Joint Operational Evaluation Board, featuring civil aviation authorities from the United States, Canada, Brazil, and the European Union, also conducted its evaluations of updated crew training. The 737 MAX has now completed around 1,400 test and check flights and more than 3,000 flight hours as it progresses through the robust and comprehensive certification process.
To adapt to the market impacts of COVID-19 and position the company for the future, Boeing continued its business transformation across five key areas including its infrastructure footprint, overhead and organizational structure, portfolio and investment mix, supply chain health and operational excellence. As the company resizes its operations to align with market realities, Boeing expects to continue lowering overall staffing levels through natural attrition as well as voluntary and involuntary workforce reductions, and recorded additional severance costs in the third quarter.
Table 2. Cash Flow
Third Quarter
Nine Months
(Millions)
2020
2019
2020
2019
Operating Cash Flow
($4,819)
($2,424)
($14,401)
($226)
Less Additions to Property, Plant & Equipment
($262)
($465)
($1,038)
($1,387)
Free Cash Flow*
($5,081)
($2,889)
($15,439)
($1,613)
*Non-GAAP measure; complete definitions of Boeing’s non-GAAP measures are on page 5, “Non-GAAP Measures Disclosures.”
Operating cash flow was ($4.8) billion in the quarter, reflecting lower commercial deliveries and services volume primarily due to COVID-19, as well as timing of receipts and expenditures (Table 2).
Table 3. Cash, Marketable Securities and Debt Balances
Quarter-End
(Billions)
Q3 20
Q2 20
Cash
$10.6
$20.0
Marketable Securities1
$16.5
$12.4
Total
$27.1
$32.4
Debt Balances:
The Boeing Company, net of intercompany loans to BCC
$59.1
$59.5
Boeing Capital, including intercompany loans
$1.9
$1.9
Total Consolidated Debt
$61.0
$61.4
1Marketable securities consists primarily of time deposits due within one year classified as “short-term investments.”
Cash and investments in marketable securities decreased to $27.1 billion, compared to $32.4 billion at the beginning of the quarter, primarily driven by operating cash outflows (Table 3). Debt was $61.0 billion, down from $61.4 billion at the beginning of the quarter due to the repayment of maturing debt.
Total company backlog at quarter-end was $393 billion.
Segment Results
Commercial Airplanes
Table 4. Commercial Airplanes
Third Quarter
Nine Months
(Dollars in Millions)
2020
2019
Change
2020
2019
Change
Commercial Airplanes Deliveries
28
62
(55)%
98
301
(67)%
Revenues
$3,596
$8,249
(56)%
$11,434
$24,793
(54)%
Loss from Operations
($1,369)
($40)
NM
($6,199)
($3,813)
NM
Operating Margin
(38.1)%
(0.5)%
NM
(54.2)%
(15.4)%
NM
Commercial Airplanes third-quarter revenue decreased to $3.6 billion, reflecting lower delivery volume primarily due to COVID-19 impacts as well as 787 quality issues and associated rework. Third-quarter operating margin decreased to (38.1) percent, primarily driven by lower delivery volume, as well as $590 million of abnormal production costs related to the 737 program.
Commercial Airplanes added the final 777X flight test airplane to the test program and the GE9X engine received FAA certification. In October, the company decided it will consolidate 787 production in South Carolina in mid-2021, which did not have a significant financial impact on the program in the third quarter. Commercial Airplanes delivered 28 airplanes during the quarter, and backlog included over 4,300 airplanes valued at $313 billion.
Defense, Space & Security
Table 5. Defense, Space & Security
Third Quarter
Nine Months
(Dollars in Millions)
2020
2019
Change
2020
2019
Change
Revenues
$6,848
$7,002
(2)%
$19,478
$20,168
(3)%
Earnings from Operations
$628
$754
(17)%
$1,037
$2,581
(60)%
Operating Margin
9.2%
10.8%
(1.6) Pts
5.3%
12.8%
(7.5) Pts
Defense, Space & Security third-quarter revenue decreased to $6.8 billion, primarily due to derivative aircraft award timing, partially offset by higher fighter volume (Table 5). Third-quarter operating margin decreased to 9.2 percent reflecting less favorable performance, including a $67 million KC-46A Tanker charge.
During the quarter, Defense, Space & Security received an award for eight F-15EX advanced fighter aircraft for the U.S. Air Force and a contract extension for the International Space Station for NASA, as well as contracts for nine additional MH-47G Block II Chinook helicopters for the U.S. Army Special Operations and four additional 702X satellites. Also in the quarter, the U.S. Air Force and Boeing team was awarded the Collier Trophy for aerospace excellence for the X-37B autonomous spaceplane. Significant milestones included inducting the 20th U.S. Navy F/A-18 into the Service Life Modification program as well as delivering the firstBell Boeing V-22 Osprey to Japan and the first MH-47G Block II Chinook to the U.S. Army Special Operations.
Backlog at Defense, Space & Security was $62 billion, of which 30 percent represents orders from customers outside the U.S.
Global Services
Table 6. Global Services
Third Quarter
Nine Months
(Dollars in Millions)
2020
2019
Change
2020
2019
Change
Revenues
$3,694
$4,658
(21)%
$11,810
$13,820
(15)%
Earnings from Operations
$271
$673
(60)%
$307
$2,013
(85%)
Operating Margin
7.3%
14.4%
(7.1) Pts
2.6%
14.6%
(12.0) Pts
Global Services third-quarter revenue decreased to $3.7 billion, driven by lower commercial services volume due to COVID-19, partially offset by higher government services volume (Table 6). Third-quarter operating margin decreased to 7.3 percent primarily due to lower commercial services volume and additional severance costs.
During the quarter, Global Services signed an agreement with GECAS for 11 737-800 Boeing Converted Freighters, secured a six-year P-8A support contract for the Royal Australian Air Force, and was awarded F-15EX training and services support contracts by the U.S. Air Force. Global Services also delivered the first P-8A Operational Flight Trainer for the United Kingdom Royal Air Force.
Additional Financial Information
Table 7. Additional Financial Information
Third Quarter
Nine Months
(Dollars in Millions)
2020
2019
2020
2019
Revenues
Boeing Capital
$71
$66
$205
$207
Unallocated items, eliminations and other
($70)
$5
($73)
($340)
Earnings from Operations
Boeing Capital
$30
$29
$47
$86
FAS/CAS service cost adjustment
$353
$364
$1,055
$1,093
Other unallocated items and eliminations
($314)
($521)
($965)
($1,731)
Other income, net
$119
$121
$325
$334
Interest and debt expense
($643)
($203)
($1,458)
($480)
Effective tax rate
49.6%
0.8%
40.1%
(350.6)%
At quarter-end, Boeing Capital’s net portfolio balance was $2.0 billion. The change in revenue and earnings from other unallocated items and eliminations was primarily due to the timing of cost allocations. Earnings from other unallocated items and eliminations was also impacted by lower enterprise research and development expense. Interest and debt expense increased due to higher debt balances. The third quarter effective tax rate reflects tax benefits related to the five year net operating loss carryback provision in the Coronavirus Aid, Relief, and Economic Security (CARES) Act as well as the impact of pre-tax losses.
Non-GAAP Measures Disclosures
We supplement the reporting of our financial information determined under Generally Accepted Accounting Principles in the United States of America (GAAP) with certain non-GAAP financial information. The non-GAAP financial information presented excludes certain significant items that may not be indicative of, or are unrelated to, results from our ongoing business operations. We believe that these non-GAAP measures provide investors with additional insight into the company’s ongoing business performance. These non-GAAP measures should not be considered in isolation or as a substitute for the related GAAP measures, and other companies may define such measures differently. We encourage investors to review our financial statements and publicly-filed reports in their entirety and not to rely on any single financial measure. The following definitions are provided:
Core Operating Earnings, Core Operating Margin and Core Earnings Per Share
Core operating earnings is defined as GAAP earnings from operations excluding the FAS/CAS service cost adjustment. The FAS/CAS service cost adjustment represents the difference between the FAS pension and postretirement service costs calculated under GAAP and costs allocated to the business segments. Core operating margin is defined as core operating earnings expressed as a percentage of revenue. Core earnings per share is defined as GAAP diluted earnings per share excluding the net earnings per share impact of the FAS/CAS service cost adjustment and Non-operating pension and postretirement expenses. Non-operating pension and postretirement expenses represent the components of net periodic benefit costs other than service cost. Pension costs, comprising service and prior service costs computed in accordance with GAAP are allocated to Commercial Airplanes and BGS businesses supporting commercial customers. Pension costs allocated to BDS and BGS businesses supporting government customers are computed in accordance with U.S. Government Cost Accounting Standards (CAS), which employ different actuarial assumptions and accounting conventions than GAAP. CAS costs are allocable to government contracts. Other postretirement benefit costs are allocated to all business segments based on CAS, which is generally based on benefits paid. Management uses core operating earnings, core operating margin and core earnings per share for purposes of evaluating and forecasting underlying business performance. Management believes these core earnings measures provide investors additional insights into operational performance as they exclude non-service pension and post-retirement costs, which primarily represent costs driven by market factors and costs not allocable to government contracts. A reconciliation between the GAAP and non-GAAP measures is provided on pages 12-13.
Free Cash Flow
Free cash flow is GAAP operating cash flow reduced by capital expenditures for property, plant and equipment. Management believes free cash flow provides investors with an important perspective on the cash available for shareholders, debt repayment, and acquisitions after making the capital investments required to support ongoing business operations and long term value creation. Free cash flow does not represent the residual cash flow available for discretionary expenditures as it excludes certain mandatory expenditures such as repayment of maturing debt. Management uses free cash flow as a measure to assess both business performance and overall liquidity. Table 2 provides a reconciliation of free cash flow to GAAP operating cash flow.
Caution Concerning Forward-Looking Statements
This press release contains “forward-looking statements” within the meaning of the Private Securities Litigation Reform Act of 1995. Words such as “may,” “should,” “expects,” “intends,” “projects,” “plans,” “believes,” “estimates,” “targets,” “anticipates,” and similar expressions generally identify these forward-looking statements. Examples of forward-looking statements include statements relating to our future financial condition and operating results, as well as any other statement that does not directly relate to any historical or current fact. Forward-looking statements are based on expectations and assumptions that we believe to be reasonable when made, but that may not prove to be accurate. These statements are not guarantees and are subject to risks, uncertainties, and changes in circumstances that are difficult to predict. Many factors could cause actual results to differ materially and adversely from these forward-looking statements. Among these factors are risks related to: (1) the COVID-19 pandemic and related government actions, including with respect to our operations, our liquidity, the health of our customers and suppliers, and future demand for our products and services; (2) the 737 MAX, including the timing and conditions of 737 MAX regulatory approvals, lower than planned production rates and/or delivery rates, and increased considerations to customers and suppliers, (3) general conditions in the economy and our industry, including those due to regulatory changes; (4) our reliance on our commercial airline customers; (5) the overall health of our aircraft production system, planned commercial aircraft production rate changes, our commercial development and derivative aircraft programs, and our aircraft being subject to stringent performance and reliability standards; (6) changing budget and appropriation levels and acquisition priorities of the U.S. government; (7) our dependence on U.S. government contracts; (8) our reliance on fixed-price contracts; (9) our reliance on cost-type contracts; (10) uncertainties concerning contracts that include in-orbit incentive payments; (11) our dependence on our subcontractors and suppliers, as well as the availability of raw materials; (12) changes in accounting estimates; (13) changes in the competitive landscape in our markets; (14) our non-U.S. operations, including sales to non-U.S. customers; (15) threats to the security of our or our customers’ information; (16) potential adverse developments in new or pending litigation and/or government investigations; (17) customer and aircraft concentration in our customer financing portfolio; (18) changes in our ability to obtain debt financing on commercially reasonable terms and at competitive rates; (19) realizing the anticipated benefits of mergers, acquisitions, joint ventures/strategic alliances or divestitures; (20) the adequacy of our insurance coverage to cover significant risk exposures; (21) potential business disruptions, including those related to physical security threats, information technology or cyber-attacks, epidemics, sanctions or natural disasters; (22) work stoppages or other labor disruptions; (23) substantial pension and other postretirement benefit obligations; and (24) potential environmental liabilities.
Additional information concerning these and other factors can be found in our filings with the Securities and Exchange Commission, including our most recent Annual Report on Form 10-K, Quarterly Reports on Form 10-Q and Current Reports on Form 8-K. Any forward-looking statement speaks only as of the date on which it is made, and we assume no obligation to update or revise any forward-looking statement, whether as a result of new information, future events, or otherwise, except as required by law.
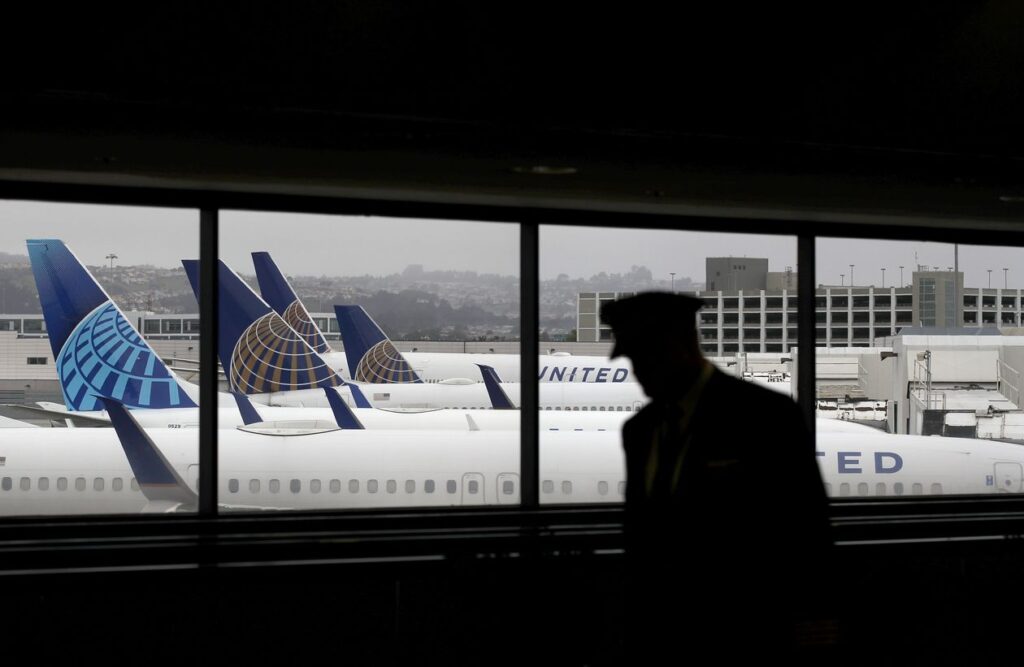
A pilot walks by United Airlines planes at the San Francisco International Airport in April. GETTY IMAGES
United Airlines Holdings Inc. stock (Nasdaq: UAL) fell late Wednesday after the airline reported a 78% drop in quarterly sales as the pandemic continued to crimp air travel.
United said it lost $1.8 billion, or $6.33 a share, in the third quarter, contrasting with earnings of $1 billion, or $3.99 a share, in the year-ago quarter.
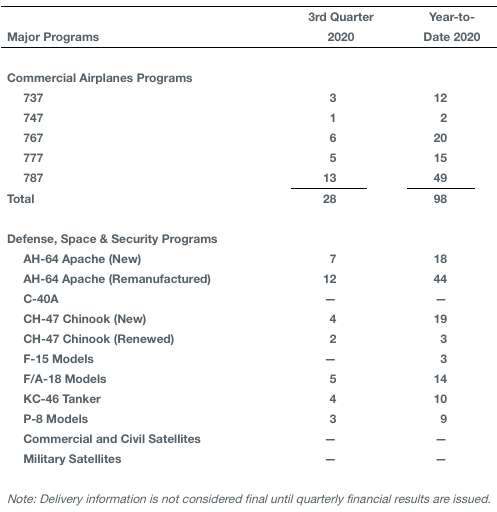
The Boeing Company [NYSE: BA] announced today major program deliveries across its commercial and defense operations for the third quarter of 2020.
“We continue to work closely with our customers around the globe, understanding their near-term and longer term fleet needs, aligning supply and demand while navigating the significant impact this global pandemic continues to have on our industry,” said Greg Smith, Boeing executive vice president of Enterprise Operations and chief financial officer. “We’re taking actions to resize, reshape and transform our business to preserve liquidity, adapt to the new market reality and ensure that we deliver the highest standards of safety and quality as we position our company to be more resilient for the long term. Our diverse portfolio, including our government services, defense and space programs, continues to provide some stability as we adapt and rebuild stronger for the other side of the pandemic.”
Major program deliveries during the third quarter were as follows:
Plans to expand UK’s Heathrow airport by architecture firm Grimshaw are in disarray as a court has deemed a third runway illegal due to climate change implications.
The UK’s court of appeal ruled today that a new runway was illegal because government ministers had not taken into account the Paris Agreement – a treaty between countries to try and keep global temperature rise below 1.5 degrees Celsius.
It is the first time a court has passed a ruling based on the Paris Agreement and potentially could set a precedent for challenges brought against projects with high emissions.
Environmental campaigners won appeal
UK architecture practice Grimshaw masterplanned a “sustainable but affordable” £14 billion extension to Heathrow in 2016. Renders showed a new terminal planted with trees underneath an undulating glass roof.
SHANGHAI (Reuters) – Ford Motor Co’s <F> China vehicle sales fell for a third consecutive year, by 26.1%, as it battles a prolonged overall sales decline in its second-biggest market that has hit demand for its mass-market Ford brand and sports utility vehicles.
The U.S. automaker delivered 146,473 vehicles in China in the fourth quarter, down 14.7% year-on-year, Ford said in a statement. In total, it sold 567,854 vehicles over 2019.
Ford has been trying to revive sales in China after its business began slumping in late 2017. Sales sank 37% in 2018, after a 6% decline in 2017.
Anning Chen, president and chief executive of Ford Greater China, said that while 2019 was a “challenging” year for the automaker, it saw its market share in the high-to-premium segment stabilize and its sales decline in the value segment start to narrow in the second-half of the year.
“The pressure from the external environment and downward trend of the industry volume will continue in 2020, and we will put more efforts into strengthening our product lineup with more customer-centric products and customer experiences to mitigate the external pressure and improve dealers’ profitability.”
The automaker plans to launch more than 30 new models in China over the next three years of which over a third will be electric vehicles. It has also said it would localize management teams by hiring more Chinese staff and aimed to improve relationships with joint venture partners.
New models it launched in the fourth quarter include a new Ford Escape version – for which the automaker said orders received so far have been much higher than expected – and the Lincoln Corsair, the first localized Lincoln model in China.
In China, Ford makes cars through a joint venture with Chongqing Changan Automobile Co Ltd and Jiangling Motors Corp Ltd (JMC). It has also said it would partner Zotye Automobile Co Ltd to sell lower priced cars.
Its larger U.S. rival General Motors Co <GM> last week said its sales in China fell 15% from a year earlier to 3.09 million vehicles in 2019, its second year of decline.
China’s auto market is set to contract by 2% in 2020 for the third year of decline, the China Association of Automobile Manufacturers (CAAM) forecast, due to a weaker economy and trade dispute with the United States.
Over 28 million vehicles were sold in 2018, down 3% from the prior year, while 2019 sales are likely to have declined 8% from the prior year, CAAM said.
(Reporting by Brenda Goh and Yilei Sun; Editing by Christian Schmollinger and Christopher Cushing)
A Ford model is seen during the China International Import Expo (CIIE), at the National Exhibition and Convention Center in Shanghai
On Monday, January 6 at 9:19 p.m. EST, or 2:19 UTC on January 7, SpaceX launched its third launch of Starlink satellites from Space Launch Complex 40 (SLC-40) at Cape Canaveral Air Force Station, Florida.
Falcon 9’s first stage supported a Starlink mission in May 2019, the Iridium-8 mission in January 2019, and the Telstar 18 VANTAGE mission in September 2018. Following stage separation, SpaceX landed Falcon 9’s first stage on the “Of Course I Still Love You” droneship, which was stationed in the Atlantic Ocean. You can watch a replay of launch below and learn more about the mission in our press kit.
Nov 29 (Reuters) – Airlines that fly to and from Hong Kong will be able to keep their prized airport slots even if they temporarily cut capacity due to weak travel demand through March, according to the Hong Kong Civil Aviation Department.
Many airlines, including flagship home carrier Cathay Pacific Airways Ltd, South African Airways and Malaysia’s AirAsia Group Bhd have cut flights to and from Hong Kong temporarily as a result of sometimes violent anti-government protests that have led to a sharp fall in tourist and business travel demand.
More than 5,800 people have been arrested since the unrest broke out in June over a proposal to allow extraditions to mainland China, the numbers grew in October and November as violence escalated.
Under more normal conditions, it is tough for airlines to get take-off and landing slots at Hong Kong’s airport because it lacks capacity until a third runway will come into operation in 2024.
A “use-it-or-lose-it” rule stipulates an airline normally only keeps slots out of historic precedence if it can demonstrate it used them at least 80% of the time in the previous airline scheduling season.
The current winter season, which began on Oct. 27, ends on March 28, 2020.
Hong Kong’s Civil Aviation Department said in a statement to Reuters on Thursday evening that in order to provide airlines with greater flexibility in aircraft deployment to deal with the fall in passenger demand, the “use-it-or-lose-it” rule had been temporarily suspended for the winter season.
Airport Authority Hong Kong reported declines in October of 13% in passengers and 6.1% in the number of inbound and outbound flights – the steepest falls since the unrest began.
(Reporting by Jamie Freed in Sydney Editing by Marguerita Choy)
Union Pacific 4014 “Big Boy” steam locomotive visits Tucson, Arizona on October 18,2019
Union Pacific implemented Positive Train Control (PTC) on 1,113 route miles in the third quarter of 2019, bringing required PTC-operated route miles to 15,791 or 93 percent, including all required passenger train routes. Nearly all Union Pacific trains operating on PTC-mandated rail lines are operating with PTC locomotives. The company expects to have implemented PTC on all required lines by end of 2019, a year before the Congressional deadline. Its interoperability efforts with other railroads will continue through 2020.
Union Pacific currently hosts 31 freight and passenger railroads, which must achieve PTC interoperability by December 2020. Eleven of these railroads are already compliant, encompassing 85% of Union Pacific’s interoperable PTC train miles. While Union Pacific’s infrastructure is PTC-ready, it is working to be PTC-interoperable with the remaining partner railroads. The company’s expectation is that they will take necessary steps to reach interoperability on our network by mid-2020.
One of the most challenging parts of PTC implementation is ensuring system interoperability among all U.S. rail lines and locomotives. Given the various readiness levels of North American freight and passenger railroads, including publicly funded commuter lines and short lines, it is important that all railroads continue working together to maintain the health, safety, resiliency, and fluidity of the rail network during PTC implementation.
Union Pacific completed PTC installation on required route miles and employee training. PTC education is ongoing as Union Pacific retrains employees and introduces the system to new employees. Training materials are tailored to a variety of employee roles, including engineer, conductor, dispatcher, maintenance of way/engineering, mechanical, signal, telecom and information technologies.
With the FRA’s conditional approval of Union Pacific’s PTC safety plan on April 26, 2017, Union Pacific is running PTC operations on more than 15,000 miles in Arizona, Arkansas, California, Colorado, Idaho, Illinois, Iowa, Kansas, Louisiana, Minnesota, Missouri, Nebraska, Nevada, New Mexico, Oklahoma, Oregon, Tennessee, Texas, Utah, Washington, Wisconsin and Wyoming. Union Pacific and freight and passenger railroads continue working together to safely implement PTC on the remaining 1,271 required route miles.