TOMORROWS TRANSPORTATION NEWS TODAY!

Tag: Adjusted

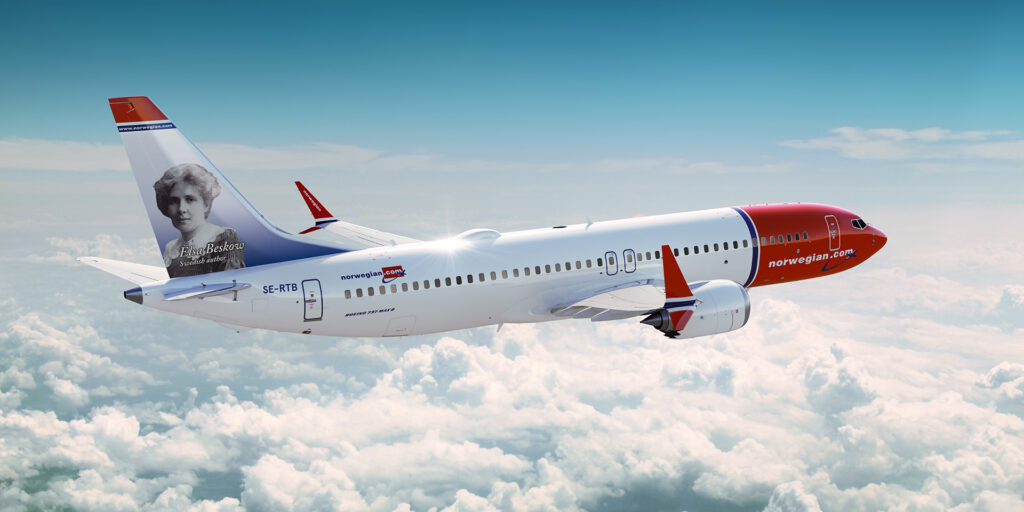
Norwegian Air welcomed 2.1 million passengers in August, 2023

Norwegian Air Shuttle ASA (NAS.OL) had 2,141,613 passengers in August, up 7 per cent from August 2022. The capacity (ASK) was 3,527 million seat kilometres, while actual passenger traffic (RPK) was 3,006 million seat kilometres. In August, Norwegian operated an average of 80 aircraft with a regularity, share of scheduled flights taking place, of 99.6 percent. The impressive results came despite operations being impacted by high winds and floods caused by Storm Hans in Southern Norway, as well as the outage at National Air Traffic Services (NATS) in the UK on 28 August. Punctuality was at 82.4 percent in August, the share of flights departing within 15 minutes of scheduled time. However, 98.0 per cent of all departed flights arrived on schedule or within one hour of scheduled arrival time, the highest level so far this year.

Solid operations and positive booking momentum

The outlook for this autumn continues to be positive. Capacity has been adjusted to meet the seasonal variation in demand for the coming winter. Norwegian is excited to release the summer programme for 2024 next week, with further routes to new destinations being added in November.

About Norwegian

Norwegian is the largest Norwegian airline and one of Europe’s leading low-cost carriers. The company has around 4,500 employees and offers a comprehensive route network between Nordic countries and destinations in Europe. Since 2002, more than 300 million passengers have flown with Norwegian. The most important task has been to offer affordable plane tickets to all and to offer more freedom of choice along the journey.

Norway Panoramic view of Lofoten Islands in Norway with sunset scenic


Delta Air Lines Announces End of June Quarterly 2021 Financial Results

ATLANTA, July 14, 2021 – Delta Air Lines (NYSE: DAL) today reported financial results for the June quarter 2021 and provided its outlook for the September quarter 2021. Highlights of the June quarter 2021 results, including both GAAP and adjusted metrics, are on page six and are incorporated here.

June Quarter Financial Results

  • Adjusted pre-tax loss of $881 million excludes $1.5 billion of benefit related to the first and second payroll support program extensions (PSP2 and PSP3, respectively) and mark-to-market adjustments on our investments
  • Adjusted operating revenue of $6.3 billion, which excludes refinery sales, declined 49 percent on 39 percent lower sellable capacity (see Note A) versus June quarter 2019
  • Total operating expense, which includes $1.5 billion of benefit related to PSP2 and PSP3, decreased $4.1 billion relative to the June quarter 2019.  Adjusted for the benefit related to the PSP programs and third-party refinery sales, total operating expense decreased $3.3 billion or 32 percent in the June quarter 2021 versus the comparable 2019 period
  • Generated $1.9 billion of operating cash flow, $1.5 billion of free cash flow and $195 million of free cash flow, adjusted in the June quarter
  • At the end of the June quarter, the company had $17.8 billion in liquidity, including cash and cash equivalents, short-term investments and undrawn revolving credit facilities. The company had total debt and finance lease obligations of $29.1 billion with adjusted net debt of $18.3 billion

Click the link below to read the full release, including the reconciliations of GAAP to non-GAAP financial measures:

Delta Air Lines Announces June Quarter 2021 Financial Results

United Airlines Third Quarter Q3 Sales Drop 78%

A pilot walks by United Airlines planes at the San Francisco International Airport in April.
 GETTY IMAGES

United Airlines Holdings Inc. stock (Nasdaq: UAL) fell late Wednesday after the airline reported a 78% drop in quarterly sales as the pandemic continued to crimp air travel.

United said it lost $1.8 billion, or $6.33 a share, in the third quarter, contrasting with earnings of $1 billion, or $3.99 a share, in the year-ago quarter.

Related: American Airlines downgrade, Delta’s weak third quarter weigh on airline stocks

Adjusted for one-time items, United lost $8.16 a share, versus an adjusted profit of $4.07 a share a year ago.

Total revenue dropped to $2.49 billion from $11.38 billion a year ago.  Passenger revenue dropped 84% to $1.7 billion.

Click the below link to see the full story!

https://www.marketwatch.com/story/united-airlines-q3-sales-drop-78-11602708906?siteid=yhoof2&yptr=yahoo

Hyatt Reports Third-Quarter 2019 Results

Strong Net Rooms Growth Fuels Nearly 11% Increase in Management and Franchise Fees

CHICAGO (October 30, 2019) – Hyatt Hotels Corporation (“Hyatt” or the “Company”) (NYSE: H) today reported third-quarter 2019 financial results. Net income attributable to Hyatt was $296 million, or $2.80 per diluted share, in the third quarter of 2019, compared to $237 million, or $2.09 per diluted share, in the third quarter of 2018. Adjusted net income attributable to Hyatt was $39 million, or $0.37 per diluted share, in the third quarter of 2019, compared to $37 million, or $0.33 per diluted share, in the third quarter of 2018. Refer to the table on page 14 of the schedules for a summary of special items impacting Adjusted net income and Adjusted earnings per share in the three months ended September 30, 2019.

Mark S. Hoplamazian, president and chief executive officer of Hyatt Hotels Corporation, said, “The strength of our brands and the consistent approach we have to operating with excellence and efficiency are serving us very well in this period of volatile economic conditions. In particular, our management and franchise fee growth of nearly 11% this quarter is driven by roughly 13% year-over-year net rooms growth. Further, we have successfully increased productivity and operating efficiency for 23 straight quarters which has allowed us to maintain strong hotel operating margins even in the face of flat RevPAR growth this quarter.”

Third quarter of 2019 financial highlights as compared to the third quarter of 2018 are as follows:

  • Net income increased 25.4% to $296 million.
  • Adjusted EBITDA decreased 7.3% to $163 million, a decrease of 6.5% in constant currency.
  • Comparable system-wide RevPAR was flat, including a decrease of 0.1% at comparable owned and leased hotels. Comparable system-wide RevPAR growth was favorably impacted by approximately 50 basis points from the timing of the Jewish holidays, but was offset by a similar reduction resulting from political unrest in Hong Kong.
  • Comparable U.S. hotel RevPAR decreased 0.6%; full service hotel RevPAR increased 0.2% and select service hotel RevPAR decreased 2.3%.
  • Net rooms growth was 13.2%, or 7.9% excluding the acquisition of Two Roads Hospitality LLC (“Two Roads”) in the fourth quarter of 2018.
  • Comparable owned and leased hotels operating margin decreased 20 basis points to 21.0%.
  • Adjusted EBITDA margin of 26.9% decreased 280 basis points in constant currency.Mr. Hoplamazian continued, “We continue to execute on our capital strategy and shift our earnings profile while maintaining our focus on global growth. We expect to end the year with approximately 57% of our earnings coming from our hotel management and franchise business, an increase of roughly 400 basis points from 2018. Our pipeline remains robust while continuing to deliver solid organic net rooms growth of almost 8% this quarter, net of the acquisition of Two Roads in the fourth quarter of 2018. While theNote: All RevPAR and ADR percentage changes are in constant dollars. This release includes references to non-GAAP financial measures. Refer to the non-GAAP reconciliations included in the schedules and the definitions of the non-GAAP measures presented beginning on page 12.

current global operating environment is challenging, we feel confident in our ability to manage through volatility and identify opportunities to strengthen our brands and performance.”

Third quarter of 2019 financial results as compared to the third quarter of 2018 are as follows:

Management, Franchise and Other Fees

Total management, franchise and other fees increased 11.9% (12.5% increase in constant currency) to $148 million. Base management fees increased 17.8% to $64 million, primarily in the Americas management and franchising segment due to the acquisition of Two Roads. Incentive management fees decreased 1.3% to $33 million. Franchise fees increased 11.8% to $37 million. Other fees increased 22.0% to $14 million. Excluding other fees, management and franchise fees increased 10.9% (11.6% increase in constant currency) to $134 million.

Americas Management and Franchising Segment

Americas management and franchising segment Adjusted EBITDA increased 11.2% (11.4% increase in constant currency), driven by higher management, franchise, and other fees from the Two Roads acquisition and recently opened hotels. RevPAR for comparable Americas full service hotels increased 1.5%, occupancy increased 70 basis points, and ADR increased 0.7%. RevPAR growth was driven by strength in certain resort locations outside of the United States and benefited from the timing of the Jewish holidays which had an approximate 110 basis point favorable impact. RevPAR for comparable Americas select service hotels decreased 2.4%, occupancy decreased 40 basis points, and ADR decreased 1.8%. Total Americas management and franchising adjusted revenues increased 29.6% (29.9% increase in constant currency) including revenue from the residential management operations acquired as part of Two Roads.

Transient rooms revenue at comparable U.S. full service hotels increased 1.0%, room nights increased 2.3%, and ADR decreased 1.3%. Group rooms revenue at comparable U.S. full service hotels decreased 0.2%, room nights decreased 2.3%, and ADR increased 2.2%.

Americas net rooms increased 11.5% compared to the third quarter of 2018, or 5.2% excluding Two Roads.

Southeast Asia, Greater China, Australia, South Korea, Japan and Micronesia (ASPAC) Management and Franchising Segment

ASPAC management and franchising segment Adjusted EBITDA increased 0.9% (2.5% increase in constant currency). RevPAR for comparable ASPAC full service hotels decreased 2.0%, reflecting weakness in Hong Kong. Excluding Hong Kong, RevPAR for comparable ASPAC full service hotels would have increased 0.8%. Occupancy decreased 50 basis points and ADR decreased 1.3% for ASPAC full service hotels. Revenue from management, franchise, and other fees increased 4.2% (5.4% increase in constant currency).

ASPAC net rooms increased 17.7% compared to the third quarter of 2018, or 13.7% excluding Two Roads.

Note: All RevPAR and ADR percentage changes are in constant dollars. This release includes references to non-GAAP financial measures. Refer to the non-GAAP reconciliations included in the schedules and the definitions of the non-GAAP measures presented beginning on page 12.

Europe, Africa, Middle East and Southwest Asia (EAME/SW Asia) Management and Franchising Segment

EAME/SW Asia management and franchising segment Adjusted EBITDA increased 4.8% (7.8% increase in constant currency). RevPAR for comparable EAME/SW Asia full service hotels increased 1.6%, driven by strong growth in certain European markets, including France and the United Kingdom, and Southwest Asia, offset partially by weaker performance in Russia which lapped the FIFA World Cup in 2018.

Occupancy increased 290 basis points and ADR decreased 2.6% for EAME/SWA full service hotels. Revenue from management, franchise, and other fees increased 2.2% (4.3% increase in constant currency).

EAME/SW Asia net rooms increased 15.6% compared to the third quarter of 2018, or 14.4% excluding Two Roads.

Owned and Leased Hotels Segment

Total owned and leased hotels segment Adjusted EBITDA decreased 17.6% (16.9% decrease in constant currency), including a decrease of 12.0% (11.4% decrease in constant currency) in pro rata share of unconsolidated hospitality ventures Adjusted EBITDA. Refer to the table on page 11 of the schedules for a detailed list of portfolio changes and the year-over-year net impact to total owned and leased hotels segment Adjusted EBITDA.

Owned and leased hotels segment revenues decreased 3.9% (3.0% decrease in constant currency), and was negatively impacted by non-comparable hotels. RevPAR for comparable owned and leased hotels decreased 0.1%. Occupancy and ADR were both flat.

Corporate and Other

Corporate and other Adjusted EBITDA decreased 22.4% (22.5% decrease in constant currency), inclusive of $6 million of expenses from the Two Roads acquisition.

Corporate and other adjusted revenues increased 19.1% (consistent in constant currency).

Selling, General, and Administrative Expenses

Selling, general, and administrative expenses increased 1.0%, inclusive of rabbi trust impact and stock- based compensation. Adjusted selling, general, and administrative expenses increased 13.8%, or $10 million, including $8 million of integration costs related to the acquisition of Two Roads. Refer to the table on page 17 of the schedules for a reconciliation of selling, general, and administrative expenses to Adjusted selling, general, and administrative expenses.

OPENINGS AND FUTURE EXPANSION

Twenty hotels (or 4,422 rooms) opened in the third quarter of 2019, contributing to a 13.2% increase in net rooms compared to the third quarter of 2018. Excluding the impact of the Two Roads acquisition, net rooms increased 7.9% compared to the third quarter of 2018.

As of September 30, 2019, the Company had executed management or franchise contracts for approximately 460 hotels, or approximately 92,000 rooms. The Company is expected to open approximately 85 hotels in the 2019 fiscal year.

Note: All RevPAR and ADR percentage changes are in constant dollars. This release includes references to non-GAAP financial measures. Refer to the non-GAAP reconciliations included in the schedules and the definitions of the non-GAAP measures presented beginning on page 12.

SHARE REPURCHASE/DIVIDEND

During the third quarter of 2019, the Company repurchased a total of 1,776,891 (1,099,507 Class A shares and 677,384 Class B shares) for approximately $133 million. The Company ended the third quarter with 36,811,374 Class A and 66,438,444 Class B shares issued and outstanding. From October 1 through October 25, 2019, the Company repurchased 523,499 shares of Class A common stock for an aggregate purchase price of approximately $37 million. As of October 25, 2019, the Company had approximately $351 million remaining under its share repurchase authorization.

The Company’s board of directors has declared a cash dividend of $0.19 per share for the fourth quarter of 2019. The dividend is payable on December 9, 2019 to Class A and Class B stockholders of record as of November 26, 2019.

CAPITAL STRATEGY UPDATE

In a Form 8-K filed on September 16, 2019, the Company announced the sale of the 1,260-room Hyatt Regency Atlanta for approximately $355 million to an unrelated third party and the entry into a long-term management agreement for the property upon sale.

The Company is in the process of pursuing the sale of one of its wholly-owned hotels and will provide further details as appropriate.

BALANCE SHEET / OTHER ITEMS
As of September 30, 2019, the Company reported the following:

  • Total debt of $1,623 million.
  • Pro rata share of unconsolidated hospitality venture debt of approximately $564 million, substantially all of which is non-recourse to Hyatt and a portion of which Hyatt guarantees pursuant to separate agreements.
  • Cash and cash equivalents, including investments in highly-rated money market funds and similar investments, of $660 million, restricted cash of $140 million, and short-term investments of $63 million.
  • Undrawn borrowing availability of $1.5 billion under Hyatt’s revolving credit facility.2019 OUTLOOK
    The Company is revising the following expectations for the 2019 fiscal year:
  • Comparable system-wide RevPAR is expected to increase approximately 0.5%, as compared to fiscal year 2018.
  • Net income is expected to be approximately $431 million to $470 million. Please refer to the table on page 13 of the schedules for revised ranges impacting net income.
  • Other income (loss), net is expected to be approximately $98 million to $103 million, reflecting increased interest income and unrealized gains on marketable securities. The estimated $40 million negative impact related to performance guarantee expense for the four managed hotels in France is unchanged.
  • Adjusted EBITDA is expected to be approximately $730 million to $745 million, primarily reflecting a one point reduction in expected comparable system-wide RevPAR and the sale ofNote: All RevPAR and ADR percentage changes are in constant dollars. This release includes references to non-GAAP financial measures. Refer to the non-GAAP reconciliations included in the schedules and the definitions of the non-GAAP measures presented beginning on page 12.

Hyatt Regency Atlanta (as previously reported in a Form 8-K filed on September 16, 2019). Refer to the table on page 13 of the schedules for a reconciliation of Net Income to Adjusted EBITDA.

  • Depreciation and amortization expense is expected to be approximately $329 million to $334 million.
  • Interest expense is expected to be approximately $77 million.
  • Adjusted selling, general, and administrative expenses are expected to be approximately $335 million. This is inclusive of approximately $25 million of expenses related to non-recurring integration costs for Two Roads. Adjusted selling, general, and administrative expenses exclude approximately $33 million of stock-based compensation expense and any potential impact related to benefit programs funded through rabbi trusts.The Company is reaffirming the following information for the 2019 fiscal year:
  • The Company expects to grow units, on a net rooms basis, by approximately 7.25% to 7.75%, reflecting approximately 85 new hotel openings.
  • Capital expenditures are expected to be approximately $375 million.
  • As previously reported in an 8-K filed on September 16, 2019, the Company expects to return approximately $500 million to shareholders through a combination of cash dividends on its common stock and share repurchases.
  • The effective tax rate is expected to be approximately 25% to 27%.

No additional disposition or acquisition activity beyond what has been completed as of the date of this release has been included in the outlook. The Company’s outlook is based on a number of assumptions that are subject to change and many of which are outside the control of the Company. If actual results vary from these assumptions, the Company’s expectations may change. There can be no assurance that Hyatt will achieve these results.

Hyatt Hotel’s Q3 Earnings Surpass, Revenues Miss Estimates

Hyatt Hotels Corporation (H) posted mixed third-quarter 2018 results, wherein earnings surpassed the Zacks Consensus Estimate while revenues lagged the same. With this, the bottom line exceeded the consensus mark for 11 straight quarters, while the top line lagged the same for the third consecutive quarter.

Adjusted earnings of 33 cents per share outpaced the consensus estimate of 25 cents by 32%. The bottom line also grew 37.5% on a year-over-year basis. Total revenues of $1,074 million inched up 0.5% from the prior-year quarter figure but missed the consensus estimate of $1,092 million.

Click the link below for the full story!

Hyatt Hotel’s 3Q Earnings Report

Image from www.hyatt.com