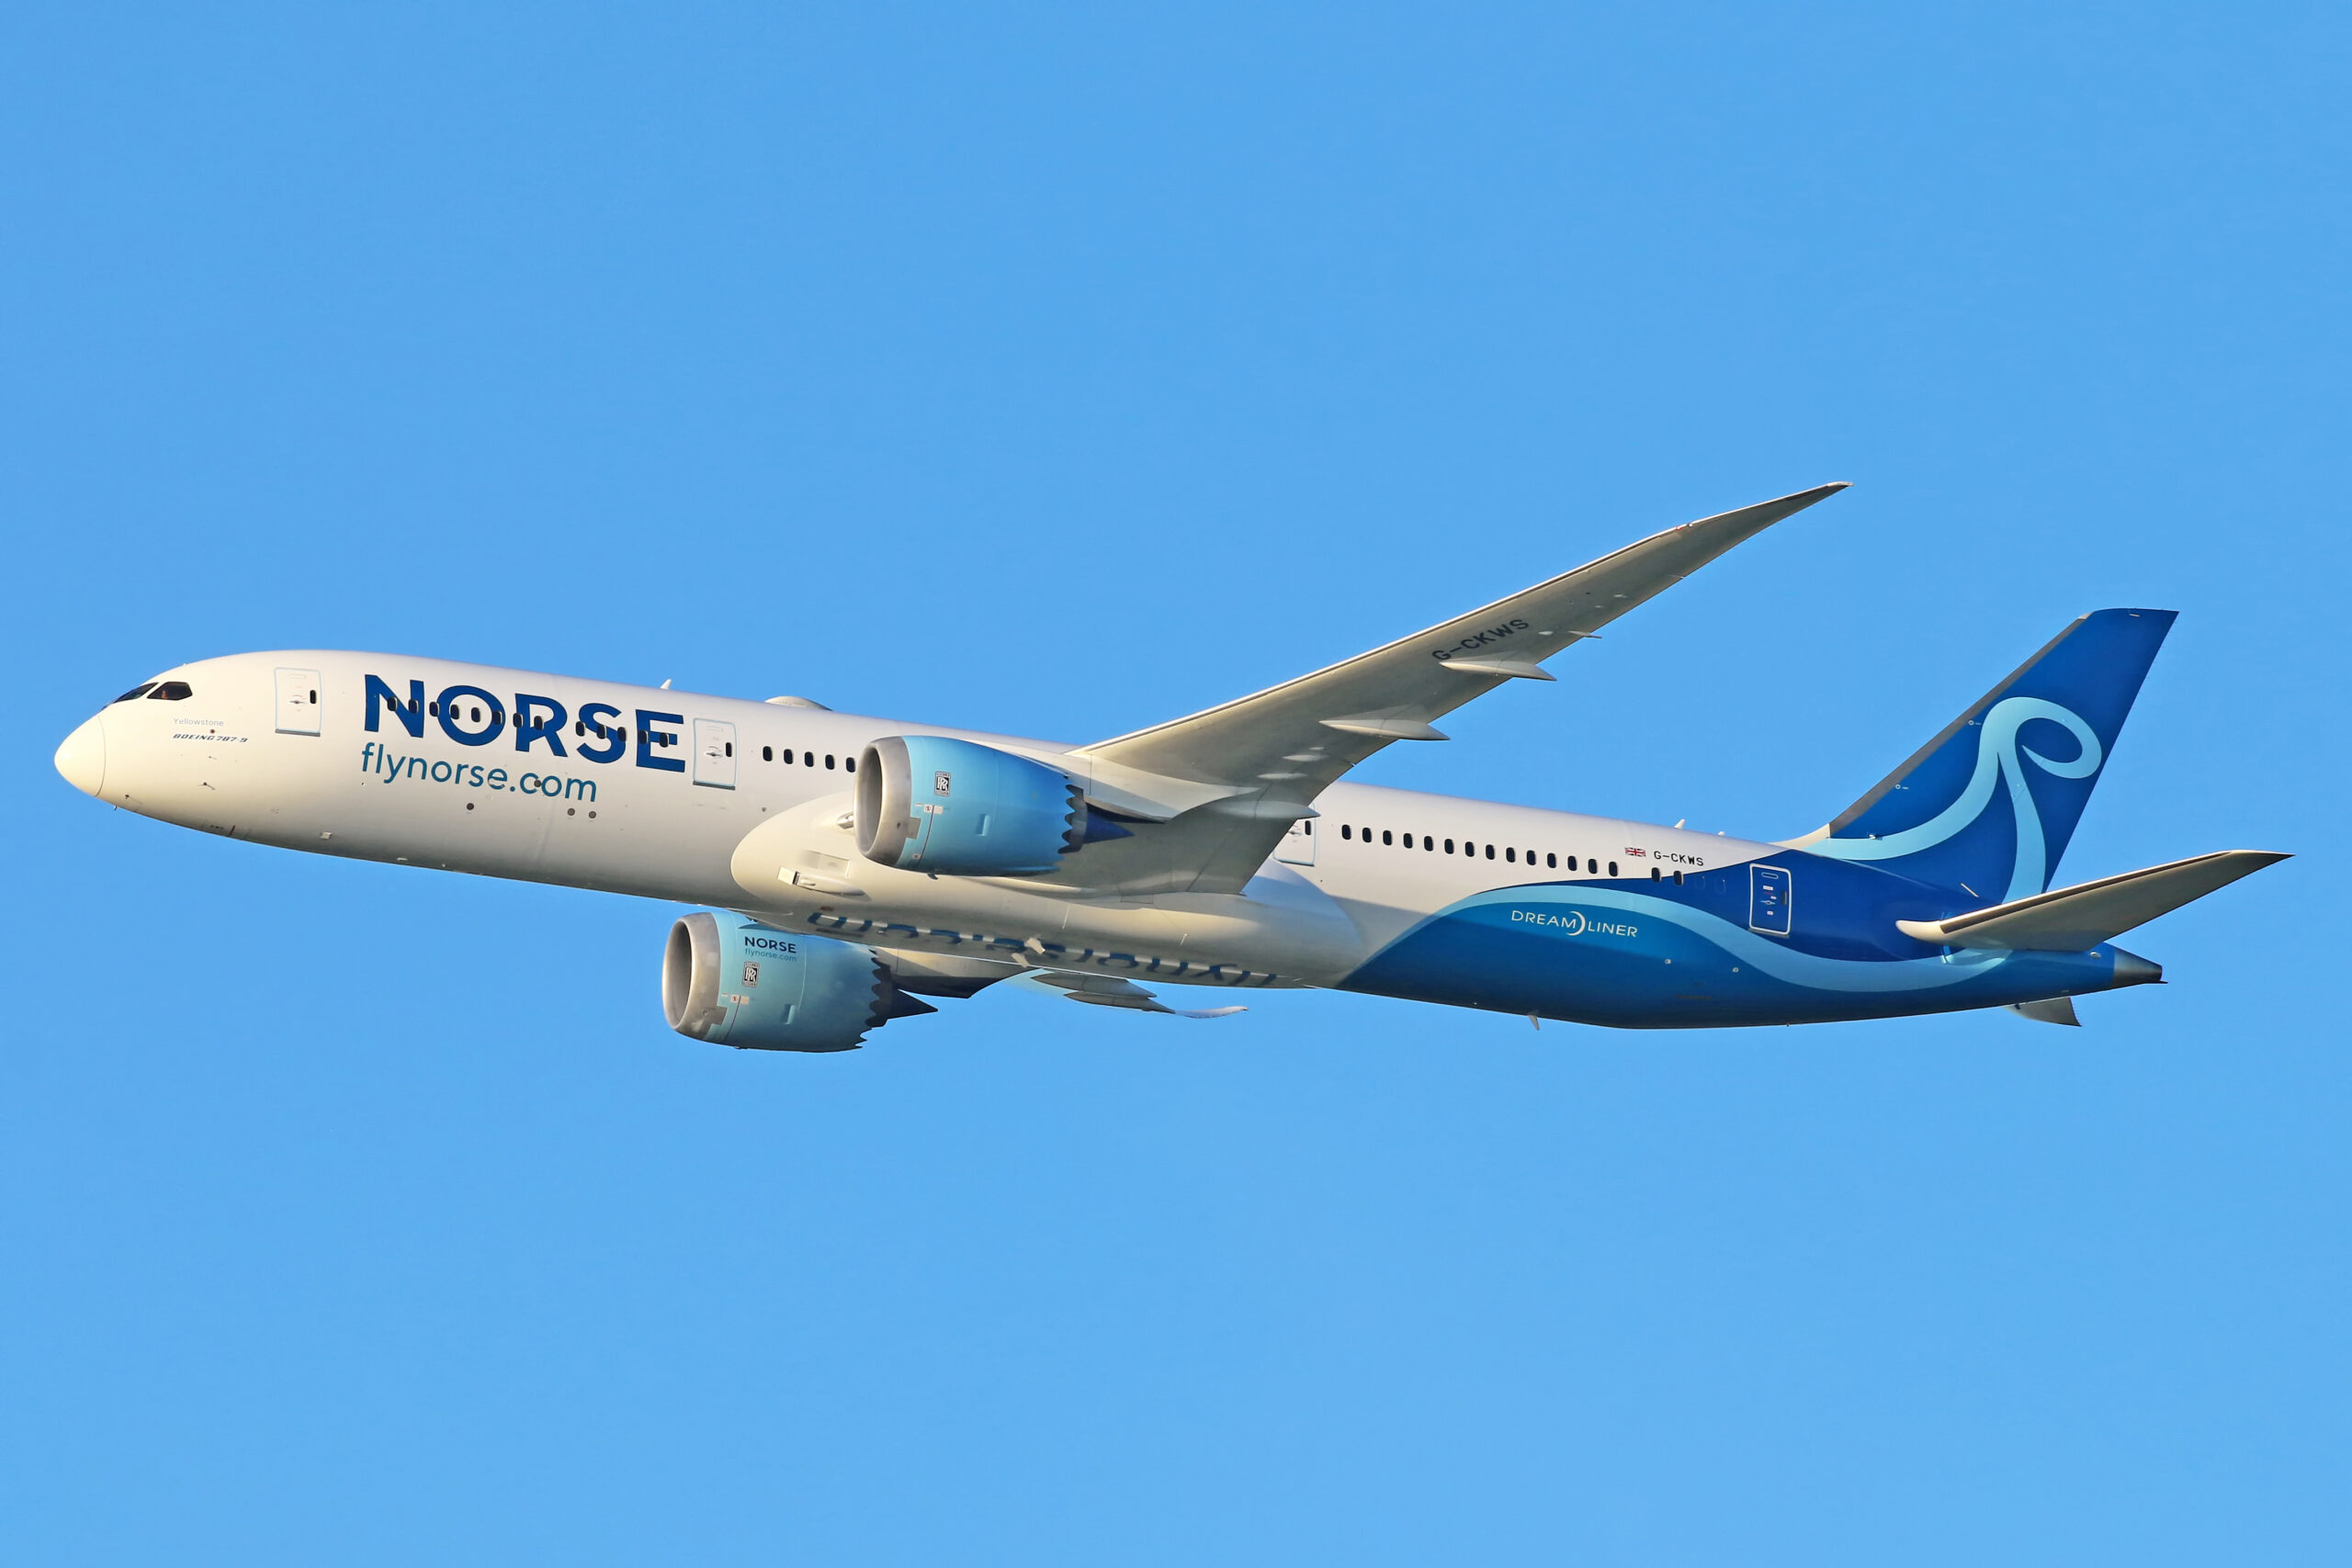
Arendal, Norway, July 10, 2023: During July, Norse Atlantic Airways (NORSE.OL) recorded an aggregate load factor for the month of 85%, an increase of two per centage points compared to the previous month and the fifth month in row that the company has recorded an increase in load factor. Norse Atlantic Airways operated a total 524 flights, an increase of 173 flights compared to the previous month. 62.5 per cent of operated flights arrived within 15 minutes of the scheduled arrival time. The company operated 100 per cent of scheduled flights for the third consecutive month. Norse Atlantic carried 150,621 passengers in July, an increase of 53,594 compared to the previous month.
Norse Atlantic Airways announced the launch of new direct flights connecting Paris to Miami from 11th December 2023 and Berlin to Miami from 15th December 2023 as part of its upcoming winter schedule. With the addition of these new routes, Norse Atlantic Airways continues to strengthen its position as a leading carrier for European passengers seeking affordable winter sun destinations.
During the month Norse Atlantic surpassed the milestone of one million booked passengers since the launch of ticket sales in April 2023.
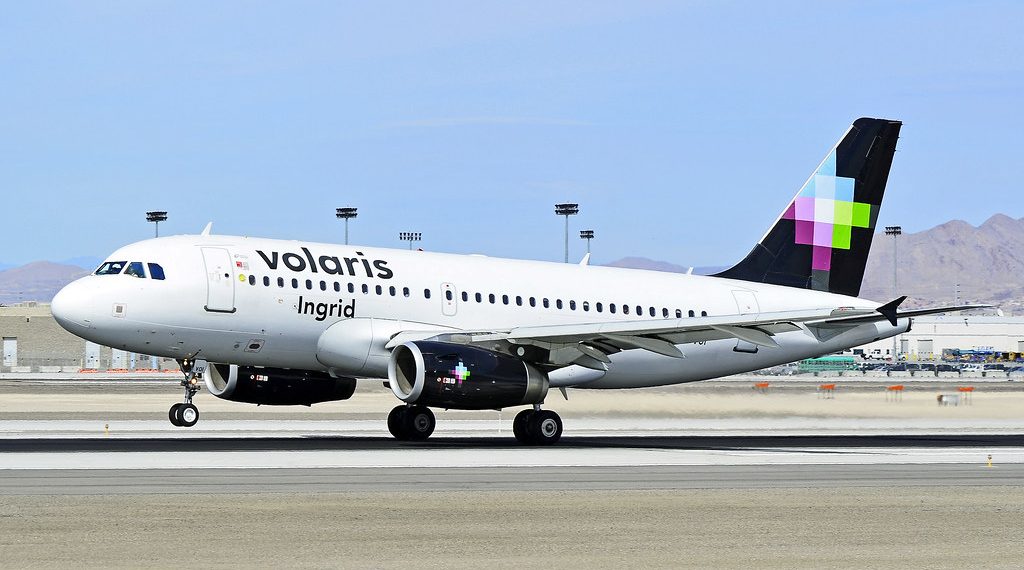
MEXICO CITY, /PRNewswire/ — Volaris (NYSE: VLRS and BMV:VOLAR), the ultra-low-cost airline serving Mexico, the United States and Central America, reports September2020 preliminary traffic results.
Volaris is well positioned for a continuing post Covid-19 traffic recovery and is regaining capacity at a fast pace, due to its strong ultra-low-cost business model focused on the VFR (Visiting Friends and Relatives) and leisure segments in the domestic and US-transborder markets. Volaris also continues to see success from its efforts to convert first time flyers through its bus switching marketing campaigns in Mexico.
In September 2020, capacity measured by ASMs (Available Seat Miles) was 84.2% compared to the same month of last year. Demandmeasured by RPMs (Revenue Passenger Miles) was 75.6% of last year. This represents an increase of 2.4% versus August 2020. Volaris transported a total of 1.3 million passengers during September 2020, an increase of 4.1% versus August 2020. Booked load factor for September 2020 was 74.4%, an increase of 1.8 pp versus August 2020. No shows were back to normal levels.
Click the link below for the full story with financials!
The sports world was in mourning following news Sunday that Kobe Bryant, his daughter Gianna, and seven other people died died in a helicopter crash. Weather is believed to have been a contributing factor in the accident, as the conditions at the time were poor. The National Transportation Safety Board has sent a team of investigators to the site.
The helicopter reportedly departed John Wayne Airport in Orange County at 9:06 a.m. local time. The group was heading to the Mamba Sports Academy in Newbury Park. The Federal Aviation Administration reported that no flight plan had been filed. The Sikorsky S-76B helicopter was flying in low clouds and fog, and was operating under “special VFR” (special visual flight rules) status, requiring the pilot to be responsible for determining safe flying requirements in challenging weather conditions..
The helicopter crashed in foggy conditions on steep terrain in the mountains near Las Virgenes Road in Calabasas, California. The crash was reported to the Los Angeles County Fire Department. The crash set off a small brush fire in the area. Firefighters were able to contain the blaze, but were not able to find any survivors.
Kobe Bean Bryant, born 23 August 1978; died 26 January 2020
FORT WORTH, Texas — American Airlines Group Inc. (NASDAQ: AAL) today reported its fourth-quarter and full-year 2019 financial results, including these highlights:
Fourth-quarter 2019 earnings were $0.95 per diluted share. Excluding net special items1, earnings were $1.15 per diluted share, up 19% year over year.
Full-year 2019 earnings were $3.79 per diluted share. Excluding net special items2, earnings were $4.90 per diluted share, up 8% year over year.
Accrued $213 million for the company’s profit-sharing program in 2019, including $74 million in the fourth quarter.
Returned $1.3 billion to shareholders in the form of dividends and share repurchases in 2019.
“During the fourth quarter, we made important progress to address the issues that impacted our business in 2019, and, thanks to our incredible team, we ended the year with our strongest operational quarter on record,” said American Airlines Chairman and CEO Doug Parker.
“While our results for the quarter reflect this progress, we know there is more work to be done. Looking to 2020, we are focused on three key areas. First, we will continue to deliver operational excellence and build on our strong fourth-quarter results. Our team has done a tremendous job, and we will keep driving improvement in key operational metrics in the year ahead. Second, we will deliver those results while growing where we have a competitive advantage in our most profitable hubs. And third, these initiatives combined with our capital plan will enable us to drive significant free cash flow in 2020 and beyond.”
Fourth-Quarter Revenue and Expenses
Pre-tax earnings were $571 million in the fourth quarter of 2019. Pre-tax earnings excluding net special items for the fourth quarter of 2019 were $679 million, a $90 million increase from the fourth quarter of 2018, or 15.1% year-over-year increase from the same period last year.
Continued strength in passenger demand and a record passenger load factor drove a 3.4% year-over-year increase in fourth-quarter 2019 total revenue to a record $11.3 billion. Driven by a 2.4% increase in passenger load factor, passenger revenue per available seat mile (PRASM) grew 0.9% to 14.72 cents, a record for the fourth quarter. Cargo revenue was down 18.3% to $216 million due primarily to a 15.6% decline in cargo volume. Other revenue was up 5.4% to $750 million due primarily to higher loyalty revenue. Fourth-quarter total revenue per available seat mile (TRASM) increased by 0.5% compared to the fourth quarter of 2018 on a 2.9% increase in total available seat miles.
Total fourth-quarter 2019 operating expenses were $10.6 billion, up 2.1% year over year, driven primarily by higher salaries and benefits, maintenance, and regional expenses. Total fourth-quarter 2019 cost per available seat mile (CASM) was 15.06 cents, down 0.8% from fourth-quarter 2018. Excluding fuel and net special items, consolidated fourth-quarter CASM was 11.59 cents, up 2% year over year.1
2020 Priorities
In 2020, American is focused on operational excellence, efficient and profitable growth, and generating significant free cash flow.
Operational excellence: Running a reliable operation is a significant driver of customers’ likelihood to recommend and American’s goal to become customers’ airline of choice.
Efficient and profitable growth: Grow in high-revenue markets that produce at or above average unit revenues, largely due to new gates in Dallas-Fort Worth and Charlotte, North Carolina.
Generating significant free cash flow3: Use free cash flow to naturally de-lever the company’s balance sheet and return capital to American’s shareholders.
Number of passengers rises by 2.9 percent year-on-year
Capacity utilisation up by 0.8 percentage points to 87.2 percent
Strongest passenger growth at Zurich hub
In August 2019, the Lufthansa Group airlines welcomed more than 14.1 million passengers. This shows an increase of 2.9 percent compared to the previous year’s month. The available seat kilometres were up 1.8 percent over the previous year, at the same time, sales increased by 2.7 percent. In addition as compared to August 2018, the seat load factor rose by 0.8 percentage points to 87.2 percent.
Cargo capacity increased by 8.9 percent year-on-year, while cargo sales increased by 1.5 percent in revenue tonne-kilometre terms. As a result, the Cargo load factor showed a corresponding reduction, decreasing by 4.2 percentage points to 58.8 percent.
Network Airlines with around 10.2 million passengers
The Network Airlines including Lufthansa German Airlines, SWISS and Austrian Airlines carried around 10.2 million passengers in August – 3.3 percent more than in the prior-year period. Compared to the previous year, the available seat kilometres increased by 3.1 percent in August. The sales volume was up by 4.0 percent over the same period, with an increasing seat load factor by 0.7 percentage points to 87.3 percent.
Strongest passenger growth at Zurich hub
In August, the strongest passenger growth of the network airlines was recorded at the Zurich hub with 7.0 percent. The number of passengers increased by 4.7 percent in Vienna and by 4.5 percent in Munich. In Frankfurt the number of passengers on the contrary decreased by 0.9 percent. The underlying offer also changed to varying degrees: In Munich the offer increased by 12.1 percent, in Zurich by 2.6 percent and in Frankfurt by 0.3 percent. In Vienna the offer decreased by 1.0 percent.
Lufthansa German Airlines transported more than 6.6 million passengers in August, a 1.8 percent increase compared to the same month last year. A 4.0 percent increase in seat kilometres corresponds to a 4.8 percent increase in sales. The seat load factor rose by 0.7 percentage points to 86.8 percent.
Eurowings increases supply and sales on short-haul routes
Eurowings (including Brussels Airlines) carried around 3.9 million passengers in August. Among this total, around 3.6 million passengers were on short-haul flights and 309,000 flew on long-haul flights. This corresponds to an increase of 1.8 percent compared with the previous year, resulting from an increase of 2.8 per cent on short-haul flights and a reduction of 8.1 per cent on long-haul flights. A 3.5 percent decrease in capacity was offset by a 2.3 percent decrease in sales, resulting in an increase of seat load factor by 1.0 percentage points to 87.0 percent.
In August, the number of seat-kilometres offered on short-haul routes was increased by 1.5 per cent, while the number of seat-kilometres sold increased by 3.5 per cent over the same period. This results in a seat load factor of 87.1 per cent, which is 1.7 percentage points higher on these flights. On long-haul flights, the seat load factor decreased by 0.4 percentage points to 86.6 per cent over the same period. The 13.4 per cent decrease in capacity was offset by a 13.8 per cent decrease in sales.
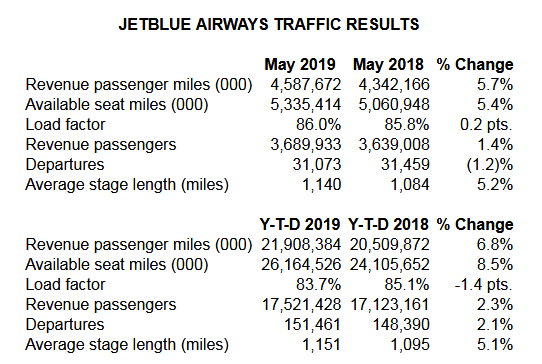
NEW YORK–(BUSINESS WIRE)– JetBlue Airways Corporation (NASDAQ:JBLU) reported its preliminary traffic results for May 2019. Traffic in May increased 5.7 percent from May 2018, on a capacity increase of 5.4 percent.
Load factor for May 2019 was 86.0 percent, an increase of 0.2 points from May 2018. JetBlue’s preliminary completion factor for May 2019 was 99.7 percent and its on-time (1) performance was 77.6 percent. JetBlue expects second quarter revenue per available seat mile (RASM) to range between 2.0 and 4.0 percent.
(1) The U.S. Department of Transportation considers on-time arrivals to be those domestic flights arriving within 14 minutes of schedule.
JetBlue is New York’s Hometown Airline®, and a leading carrier in Boston, Fort Lauderdale-Hollywood, Los Angeles (Long Beach), Orlando, and San Juan. JetBlue carries more than 42 million customers a year to 100+ cities in the U.S., Caribbean, and Latin America with an average of more than 1,000 daily flights. For more information please visit jetblue.com.
SÃO PAULO, March 6, 2019 /PRNewswire/ — Azul S.A., “Azul”, (B3: AZUL4, NYSE: AZUL), the largest airline in Brazil by number of cities served and flight departures, announces today its preliminary traffic results for February 2019.
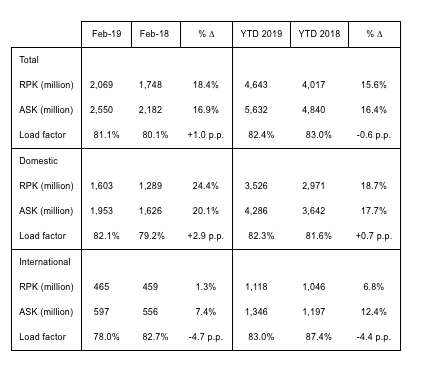
Consolidated passenger traffic (RPKs) increased 18.4% compared to February 2018on a capacity increase (ASKs) of 16.9% resulting in a load factor of 81.1%, an increase of 1.0 p.p. compared to the same period in 2018. Domestic load factor was 82.1% and international was 78.0%.
“We had a very strong February with domestic demand growing 24.4% resulting in a load factor of 82.1%, up 2.9 percentage points. We couldn’t be more excited about the results we are seeing from the A320neos. We now have 24 next-generation aircraft in our fleet and will continue to focus on accelerating our fleet transformation plan going forward,” says John Rodgerson, Azul’s CEO.
Year to date we continue to be the most on-time airline in Brazil with 85.6% of flights departing within 15 minutes of departure time, according to FlightStats.
About Azul
Azul S.A. (B3: AZUL4, NYSE: AZUL), the largest airline in Brazil by number of cities served, offers 821 daily flights to 110 destinations. With an operating fleet of 123 aircraft and more than 11,000 crewmembers, the Company has a network of 220 non-stop routes as of December 31, 2018. In 2018, Azul was awarded best airline in Latin America by TripAdvisor Travelers’ Choice and by Kayak’s Flight Hacker Guide, and also best regional carrier in South America for the eighth consecutive time by Skytrax. Azul also ranked as most on-time airline in Brazil in 2018 according to FlightStats. For more information visit www.voeazul.com.br/ir
This traffic release includes estimates and forward-looking statements within the meaning of the U.S. federal securities laws. These estimates and forward-looking statements are based mainly on our current expectations and estimates of future events and trends that affect or June affect our business, financial condition, results of operations, cash flow, liquidity, prospects and the trading price of our preferred shares, including in the form of ADSs. Although we believe that these estimates and forward-looking statements are based upon reasonable assumptions, they are subject to many significant risks, uncertainties and assumptions and are made in light of information currently available to us. In addition, in this release, the words “June,” “will,” “estimate,” “anticipate,” “intend,” “expect,” “should” and similar words are intended to identify forward-looking statements. You should not place undue reliance on such statements, which speak only as of the date they were made. Azul is not under the obligation to update publicly or to revise any forward-looking statements after we distribute this press release because of new information, future events or other factors. Our independent public auditors have neither examined nor compiled the forward-looking statements and, accordingly, do not provide any assurance with respect to such statements. In light of the risks and uncertainties described above, the future events and circumstances discussed in this release might not occur and are not guarantees of future performance. Because of these uncertainties, you should not make any investment decision based upon these estimates and forward-looking statements.
Singapore Airlines, which first introduced iPads to the airline cockpit back in 2015, has explained the difference they have made – and its plans for the future.
The airline also noted a simple user interface trick it employs to make apps easier to use …
CNET reports that the airline went beyond the weather forecasts and flight chart information that many airlines now put on iPads instead of paper.